
Diagnostics
Getting Started
The balenaCloud Dashboard includes the ability to run diagnostics on a device to determine its current condition. This should be the first step in attempting to diagnose an issue without having to actually access the device via SSH. Ensuring diagnostics and health checks are examined first ensures that you have a good idea of the state a device is in before SSHing into it, as well as ensuring that the information can be accessed later if required (should a device be in a catastrophic state). This helps significantly in a support post-mortem should one be required.
Currently, diagnosis feature is only available via the Dashboard. Diagnostics are split into three separate sections:
Device Health Checks
To run device health checks through balenaCloud dashboard, head to the Diagnostics tab in the sidebar and click the Run checks button to start the tests.
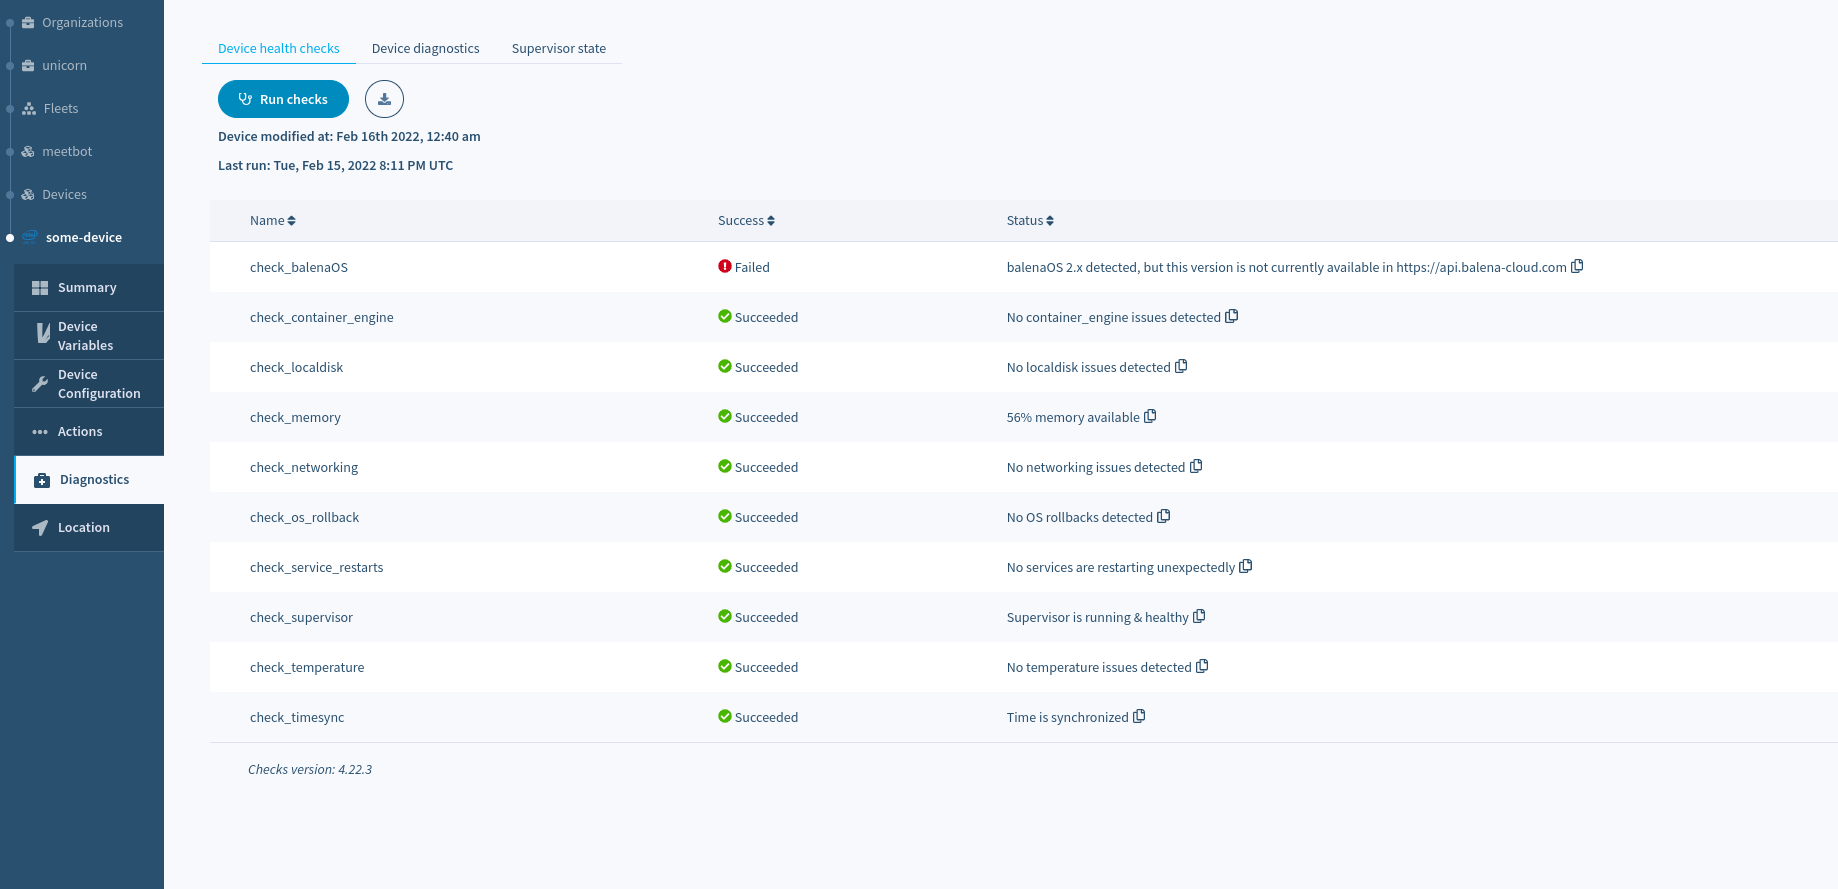
As part of the diagnostics suite, you will find a group of checks that can be collectively run on-device. Below is a description of each check and what each means or how to triage.
A check in this context is defined as a function that returns a result (good/bad status plus some descriptive text), whereas a command is simply a data collection tool without any filtering or logic built in. Checks are intended to be used by everyone, while typically command output is used by support/subject matter experts and power users.
check_balenaOS
Summary
This check confirms that the version of balenaOS is >2.x. There is further confirmation that the OS release has not since been removed from production. As of May 1, 2019, balenaOS 1.x has been deprecated.
Triage
Upgrade your device to the latest balenaOS 2.x (contact support if running 1.x).
Depends on
Parts of this check depend on fully functional networking stack (see check_networking).
check_under_voltage
Summary
Often seen on Raspberry Pi devices, these kernel messages indicate that the power supply is insufficient for the device and any peripherals that might be attached. These errors also precede seemingly erratic behavior.
Triage
Replace the power supply with a known-good supply (supplying at least 5V / >2.5A).
check_memory
Summary
This check simply confirms that a given device is running at a given memory threshold (set to 90% at the moment). Oversubscribed memory can lead to OOM events.
Triage
Using a tool like top, scan the process table for which process(es) are consuming the most memory (%VSZ) and check
for memory leaks in those services.
Further Reading
Oversubscribed memory can lead to OOM events (learn more about the out-of-memory killer).
check_container_engine
Summary
This check confirms the container engine is up and healthy. Additionally, this check confirms that there have been no unclean restarts of the engine. These restarts could be caused by crashlooping. The container engine is an integral part of the balenaCloud pipeline.
Triage
It is best to let balena's support team take a look before restarting the container engine. At the very least, take a diagnostics snapshot before restarting anything.
check_supervisor
Summary
This check confirms the Supervisor is up and healthy. The Supervisor is an integral part of the balenaCloud pipeline. The Supervisor depends on the container engine being healthy (see check_container_engine). There is also a check to confirm the running Supervisor is a released version, and that the Supervisor is running the intended release from the API.
Triage
It is best to let balena's support team take a look before restarting the supervisor. At the very least, take a diagnostics snapshot before restarting anything.
check_localdisk
Summary
This check combines a few metrics about the local storage media and reports back any potential issues.
test_disk_space
Summary
Confirms device disk utilization is below a set threshold (90%). High disk usage can cause issues in supervisor and release containers.
Triage
Run `du -a /mnt/data/docker
Further Reading
If the results indicate large files in /mnt/data/docker/containers, this result often indicates a leakage in a container that can be cleaned up (runaway logs, too much local data, etc). Further info can be found in the Device Debugging Masterclass.
test_write_latency
Summary
Compares partition's average write latency to a target (1s), accounting for write number and size variability.
Triage
Slow disk writes could indicate hardware issues or heavy disk I/O, warranting further investigation.
Further Reading
There are some caveats to this test that are worth considering. Since it attempts to categorize a distribution with a point sample, the reported sample size should always be considered. Smaller sample sizes are prone to fluctuations that do not necessarily indicate failure. Additionally, the metric sampled is merely the number of writes disregarding the size of each write, which again may be noisy with few samples. Writes come primarily from application workloads and less often from operating system operations. For more information, see the relevant kernel documentation.
test_disk_expansion
Summary
Ensures the host OS has expanded the partition at boot, allocating >80% of total disk space.
Triage
Failure to expand root filesystem may indicate storage issues or provisioning failures. It is best to contact support, replace the storage media and re-provision the device.
test_data_partition_mounted
Summary
Confirms the data partition is properly mounted.
Triage
Failure to mount the data partition can indicate an unhealthy storage medium or other problems on the device. It is best to contact support to investigate further.
check_timesync
Summary
Verifies system clock synchronization.
Triage
Confirm that NTP is not blocked at the network level, and that any specified upstream NTP servers are accessible. If absolutely necessary, it is possible to temporarily sync the clock using HTTP headers (though this change will not persist across reboots). Further info can be found in the Device Debugging Masterclass.
Depends on
Depends on a fully functional networking stack (see check_networking).
check_temperature
Summary
Monitors for high temperature and CPU throttling signs.
test_temperature_now
Confirms temperature is below 80C to prevent throttling.
test_throttling_dmesg
Searches kernel logs for CPU throttling evidence.
check_os_rollback
Summary
Confirms no failed boots & rollbacks have been noted by the host OS.
Triage
For detailed investigation, contact support. Read more about Rollbacks.
check_networking
Summary
Tests for common network failures impacting container lifecycle. Includes various network functionality tests.
Depends on
Healthy container engine (check_container_engine).
Triage
Solutions may involve addressing local network issues or connectivity reliability.
check_user_services
Summary
Queries engine for restarts or healthcheck failures in user-defined services. Allows custom health checks via Dockerfile.
Triage
Investigate logs for services restarting or failing healthchecks. Issues may lie in error handling or service startup.
Depends on
Healthy container engine (check_container_engine).
check_networking
This tests common network failures that impact container lifecycle and check if all networking requirements are being met. This health check internally involves the following tests.
Test Upstream DNS
Confirms that certain FQDNs are resolvable by each of the configured upstream DNS addresses.
Only the failed upstream DNS addresses will be shown in the test results.
Test WiFi
Confirms that if a device is using WiFi, the signal level is above a threshold.
Test Ping
Confirms that packets are not dropped during an ICMP ping.
Test IPv4 Stack
Confirms that the device can reach a public IPv4 endpoint when an IPv4 route is detected.
Test IPv6 Stack
Confirms that the device can reach a public IPv6 endpoint when an IPv6 route is detected.
If necessary, you can disable IPv6 entirely on a device.
Test Balena API
Confirms that the device can communicate with the balenaCloud API.
Commonly, firewalls or MiTM devices can cause SSL failures here.
Test DockerHub
Confirms that the device can communicate with the Docker Hub.
Test Balena Registry
An end-to-end check that tries to authenticate with the balenaCloud registry.
The networking health check depends on the container engine being healthy (see check_container_engine).
test_balena_registry
Description
This test is an end-to-end check that tries to authenticate with the balenaCloud registry, confirming that all other points in the networking stack are behaving properly.
Depends on
This test depends on the container engine being healthy (see check_container_engine).
Triage
Depending on what part of this check failed, there are various fixes and workarounds. Most, however, will involve a restrictive local network or an unreliable connection.
check_user_services
Summary
Any checks with names beginning with check_service_ come from user-defined services. These checks query the engine to see if any services are restarting uncleanly/unexpectedly.
Triage
Investigate the logs of whichever service(s) are restarting uncleanly or failing health checks. This issue could be a bug in the error handling or start-up of the aforementioned unhealthy services. These checks are wholly limited in scope to user services and should be triaged by the developer.
Depends on
This check depends on the container engine being healthy (see check_container_engine).
Building & Surfacing your own healthchecks in the dashboard
We allow users to provide their own health checks using the HEALTHCHECK directive defined in the Dockerfile or docker-compose file. With healthchecks, you can test a container to check that it's still working and healthy.
Any health check output will be collected as-is, truncated to 100 characters, and shown as output along with the exit code. The result of the health check will be available in the dashboard in the Diagnostics page under the Device health checks tab.
Here's a working example of how HEALTHCHECK directive works in a balenaCloud dashboard demo.
Device Diagnostics
Move to the Device Diagnostics tab on the Diagnostics page and click the Run diagnostics button.
Device diagnostics can be considered a more detailed snapshot of a running system as opposed to the healthchecks, which give the current status of a few of the core components of the OS.
Once the diagnostic run has completed, you'll see a lot of logs from commands that have been run. The section --- COMMANDS --- shows a list of all of the commands that are run to produce the diagnostics report. These commands cover a wide range of functionality, but are comprised of 5 main areas:
BALENA - The balenaEngine and latest journals
HARDWARE - All aspects of HW, including CPU, memory and device tree info as well as statistics on device nodes, USB devices and disk space
NETWORK - Covering everything from the current interface configurations to test pings/curls of remote hosts, the state of DNSmasq, OpenVPN and the current iptables configuration
OS - This includes the current device configuration, the kernel log, the boot journal and the state of any HUP that may have been attempted
SUPERVISOR - The current state and logs for the Supervisor
TIME - The current date, state of the time and uptime for the device
Examination of this output will help to determine if something is not working correctly.
Supervisor State
Click the Supervisor State tab on the Diagnostics page.
This does not require execution, and immediately queries the Supervisor to determine its current configuration. This output is shown in two panels:
Supervisor status - This is the current status of the Supervisor, including the address and port it can be reached on, the versions pertaining to it and the current status (note that this only works should the VPN be operational and connected to the balenaCloud backend).
Target supervisor state - This is the target state for the Supervisor, based upon the release the device is associated with (usually this is the latest release, unless otherwise pinned). This includes all of the services, and any configuration set for each service, for the fleet, as well as configuration (such as boot and device tree settings).
The Supervisor status should always be available; if it isn't, this is an initial indication that something is wrong (including the Supervisor itself failing to run).
The Supervisor status is useful for ensuring that versions of the Supervisor/OS and access to the API is as expected (or has been changed, should access be required).
The Target supervisor state is extremely useful for ensuring that a release is running correctly upon a device (as the docker-compose manifest for the release can be read from the fleet's 'Release' page in the Dashboard), as well as ensuring it's the commit that's expected.
DIAGNOSE_VERSION=4.23.1
Last updated
Was this helpful?