Balena Device Debugging Masterclass
Prerequisite Classes
This masterclass builds upon knowledge that has been taught in previous classes. To gain the most from this masterclass, we recommend that you first undertake the following masterclasses:
Introduction
At balena, we believe the best people to support a customer are the engineers who build the product. They have the depth and breadth of knowledge that can quickly identify and track down issues that traditional support agents usually do not. Not only does this help a customer quickly and efficiently solve most issues, but it also immerses balena engineers in sections of the product they might not otherwise encounter in their usual working life, which further improves the support each engineer can offer. This masterclass has been written as an initial guide for new engineers about to start support duties.
Whilst the majority of devices never see an issue, occasionally a customer will contact balena support with a query where one of their devices is exhibiting anomalous behavior.
Obviously, no guide can cover the range of queries that may occur, but it can give an insight into how to tackle problems and the most common problems that a balena support agent sees, as well as some potential solutions to these problems. In compiling this document, a group of highly seasoned balena engineers discussed their techniques for discovering and resolving on-device issues, as well as techniques for determining how best to mitigate an issue being exhibited.
In this masterclass, you will learn how to:
- Gain access to a customer device, when permission has been granted
- Retrieve initial diagnostics for the device
- Identify and solve common networking problems
- Work with the Supervisor
- Work with balenaEngine
- Examine the Kernel logs
- Understand media-based issues (such as SD card corruption)
- Understand how heartbeat and the VPN only status affects your devices
Whilst this masterclass is intended for new engineers about to start support duties at balena, it is also intended to act as an item of interest to customers who wish to know more about how we initially go about debugging a device (and includes information that customers themselves could use to give a support agent more information). We recommend, however, ensuring balena support is always contacted should you have an issue with a device that is not working correctly.
Note: The balena VPN service was renamed to cloudlink in 2022 in customer facing documentation.
Hardware and Software Requirements
It is assumed that the reader has access to the following:
- A local copy of this repository Balena Device Debugging Masterclass. This copy can be obtained by either method:
git clone https://github.com/balena-io-projects/debugging-masterclass.git- Download ZIP file (from 'Clone or download'->'Download ZIP') and then unzip it to a suitable directory
- A balena supported device, such as a balenaFin 1.1, Raspberry Pi 3 or Intel NUC. If you don't have a device, you can emulate an Intel NUC by installing VirtualBox and following this guide
- A suitable shell environment for command execution (such as
bash) - A balenaCloud account
- A familiarity with Dockerfiles
- An installed instance of the balena CLI
Exercises
The following exercises assume access to a device that has been provisioned. As per the other masterclasses in this series we're going to assume that's a Raspberry Pi 4, however you can simply alter the device type as appropriate in the following instructions. The balena CLI is going to be used instead of the WebTerminal in the balenaCloud Dashboard for accessing the device, but all of the exercises could be completed using the WebTerminal if preferred.
First login to your balena account via balena login, and then create a new
fleet:
$ balena fleet create DebugFleet --type raspberrypi4-64 --organization ryanh
Fleet created: slug "ryanh/debugfleet", device type "raspberrypi4-64"
Now provision a device by downloading and flashing a development image from the Dashboard (via Etcher), or by flashing via the command line.
$ balena os download raspberrypi4-64 --version "2022.7.0.dev" --output balena-debug.img
Getting device operating system for raspberrypi4-64
balenaOS image version 2022.7.0 downloaded successfully
Note: Above, we used a balenaOS Extended Support Release (ESR). These ESRs are currently available for many device types, but only on paid plans and balena team member accounts. If you are going through this masterclass on a free plan, just pick the latest release available and the remainder of the guide is still applicable.
Carry out any configuration generation required, should you be using a Wifi AP and inject the configuration into the image (see balena CLI Advanced Masterclass for more details), or use a configuration for an ethernet connection:
$ balena os configure balena-debug.img --fleet DebugFleet --config-network=ethernet
Configuring operating system image
$ balena util available-drives
DEVICE     SIZE    DESCRIPTION
/dev/disk2 31.9 GB TS-RDF5 SD Transcend Media

$ balena os initialize balena-debug.img --type raspberrypi4-64 --drive /dev/disk2 --yes
Initializing device

Note: Initializing the device may ask for administrative permissions
because we need to access the raw devices directly.
Going to erase /dev/disk2.
Admin privileges required: you may be asked for your computer password to continue.
Writing Device OS [========================] 100% eta 0s
Validating Device OS [========================] 100% eta 0s
You can safely remove /dev/disk2 now
You should now have a device that will appear as part of the DebugFleet fleet:
$ balena devices | grep debugfleet
7830516 9294512 average-fire  raspberrypi4-64   debugfleet       Idle   true      14.0.8             balenaOS 2022.7.0 https://dashboard.balena-cloud.com/devices/92945128a17b352b155c2ae799791389/summary
For convenience, export a variable to point to the root of this masterclass repository, as we'll use this for the rest of the exercises, eg:
$ export BALENA_DEBUGGING_MASTERCLASS=~/debugging-masterclassFinally, push the code in the multicontainer-app directory to the fleet:
$ cd $BALENA_DEBUGGING_MASTERCLASS/multicontainer-app
$ balena push DebugFleet
1. Accessing a User Device
Any device owned by you will automatically allow access via either the WebTerminal (in the device's Dashboard page), or the balena CLI via balena ssh <uuid>. However, for a support agent to gain access to a device that isn't owned by them, you would need to grant access for it explicitly.
1.1 Granting Support Access to a Support Agent
It is possible to grant support access to a device, all devices in a fleet or to a block to enable support and device troubleshooting by balena employees.
Access is granted for a set, user-defined period, and access may be revoked at any time. Access for support agents is limited, which includes variables and configurations (both fleet and device), the ability to reboot the device, apply balenaOS upgrades, pin releases, etc. This is not a comprehensive list and may be subject to further changes.
This ensures that a device under investigation cannot be unnecessarily altered or modified. Support investigations are intended as an avenue of exploration and research for ensuring that issues are categorized to allow improvements to the product surface such that these issues are eliminated.
Once support access has been granted, a support agent will be able to use the UUID of a device to gain access to it. Support access is enabled via SSH over cloudlink, so the device must be online and connected to cloudlink. Alternatively, it may be possible to access a problematic device from a gateway device operating on the same network.
Note: It is possible to disable support access functionality by removing the balena SSH public key from the device. However, this will render the device inaccessible remotely for the purposes of support and updates to the host OS. For more details see our security documentation.
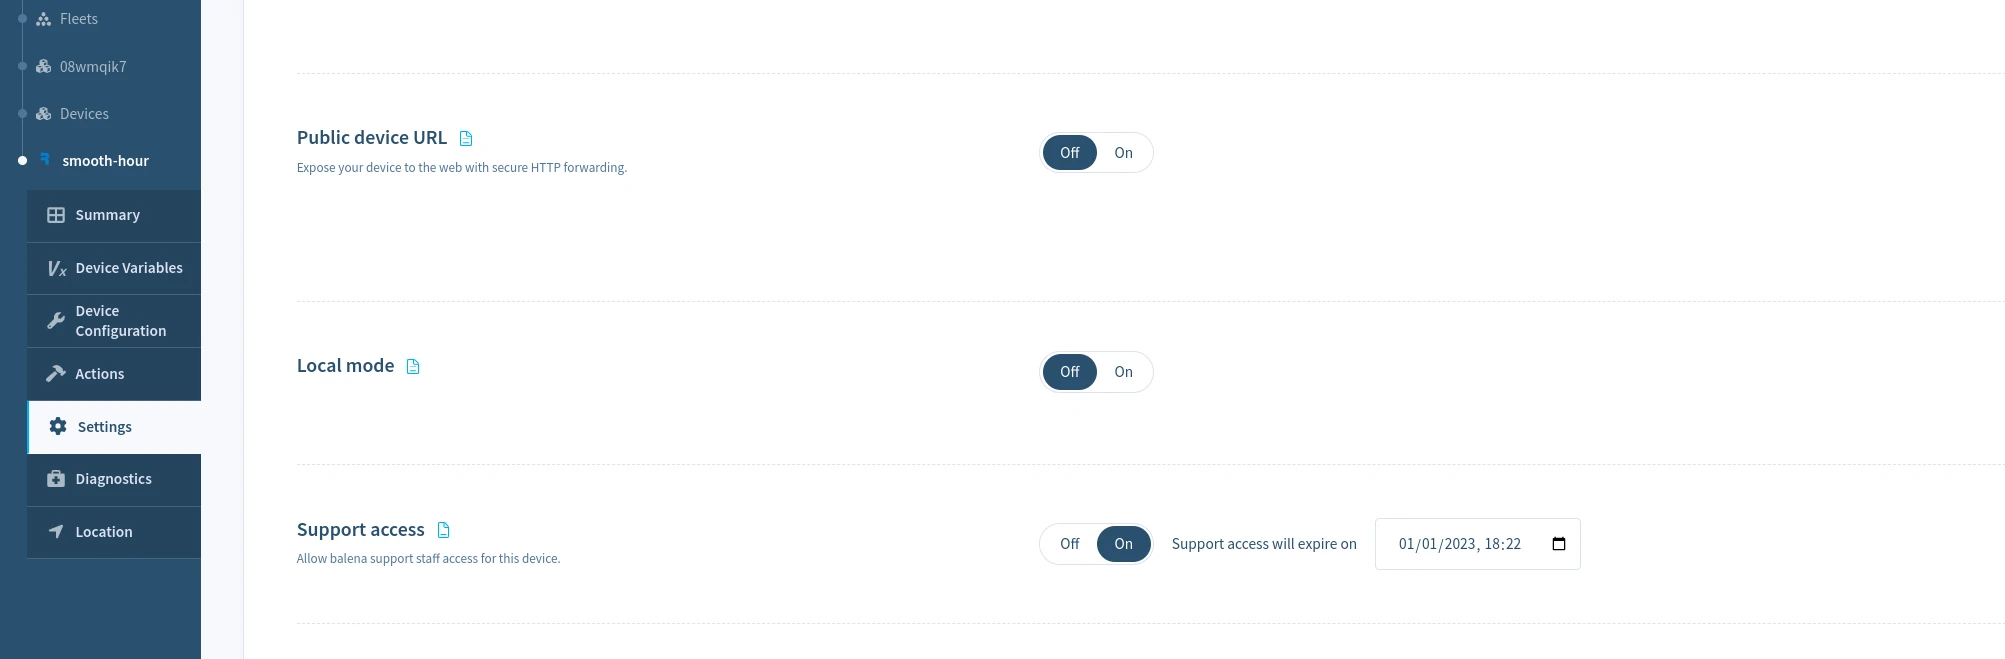
Grant support access for a device
To enable support access for a single device, select the Actions menu in the Device dashboard, and choose the Grant Support Access button and choose the period to grant device access. You may revoke access at any time by selecting Revoke Support Access on the same page.
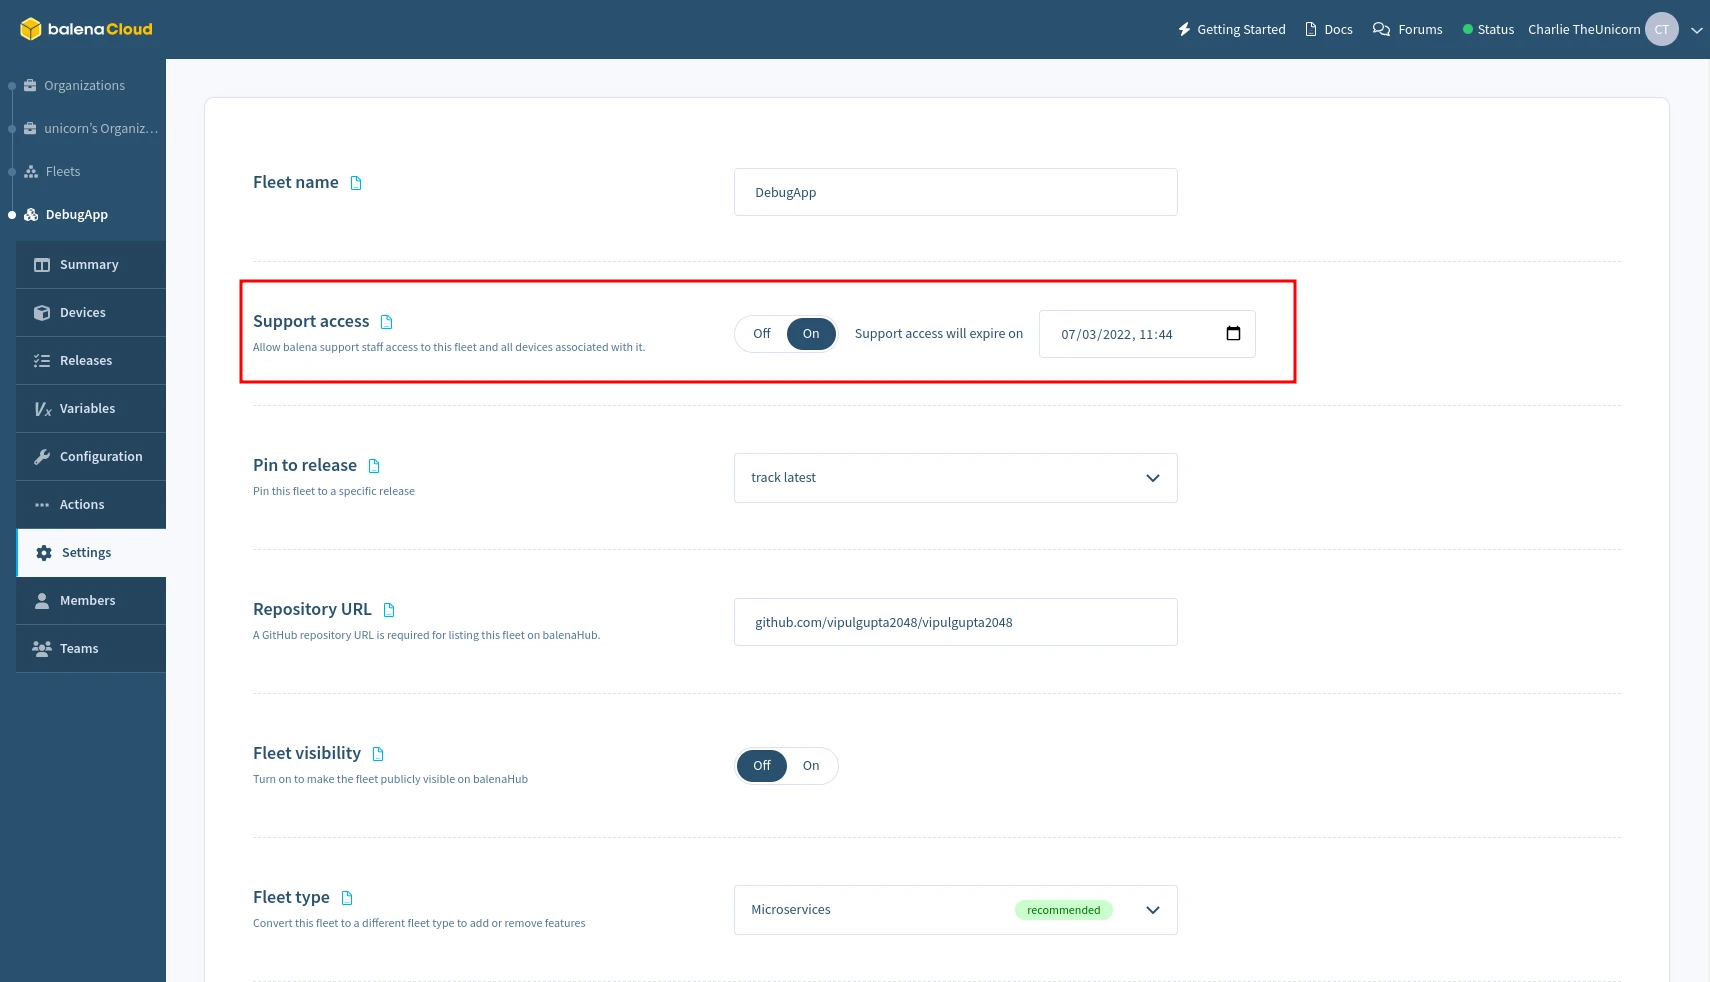
Grant support access for a fleet
To enable support access for all devices in a fleet, select the Grant Support Access from the Settings menu of the Fleet dashboard, and choose the period to grant access. This may be revoked at any time by selecting Revoke Support Access on the same page.
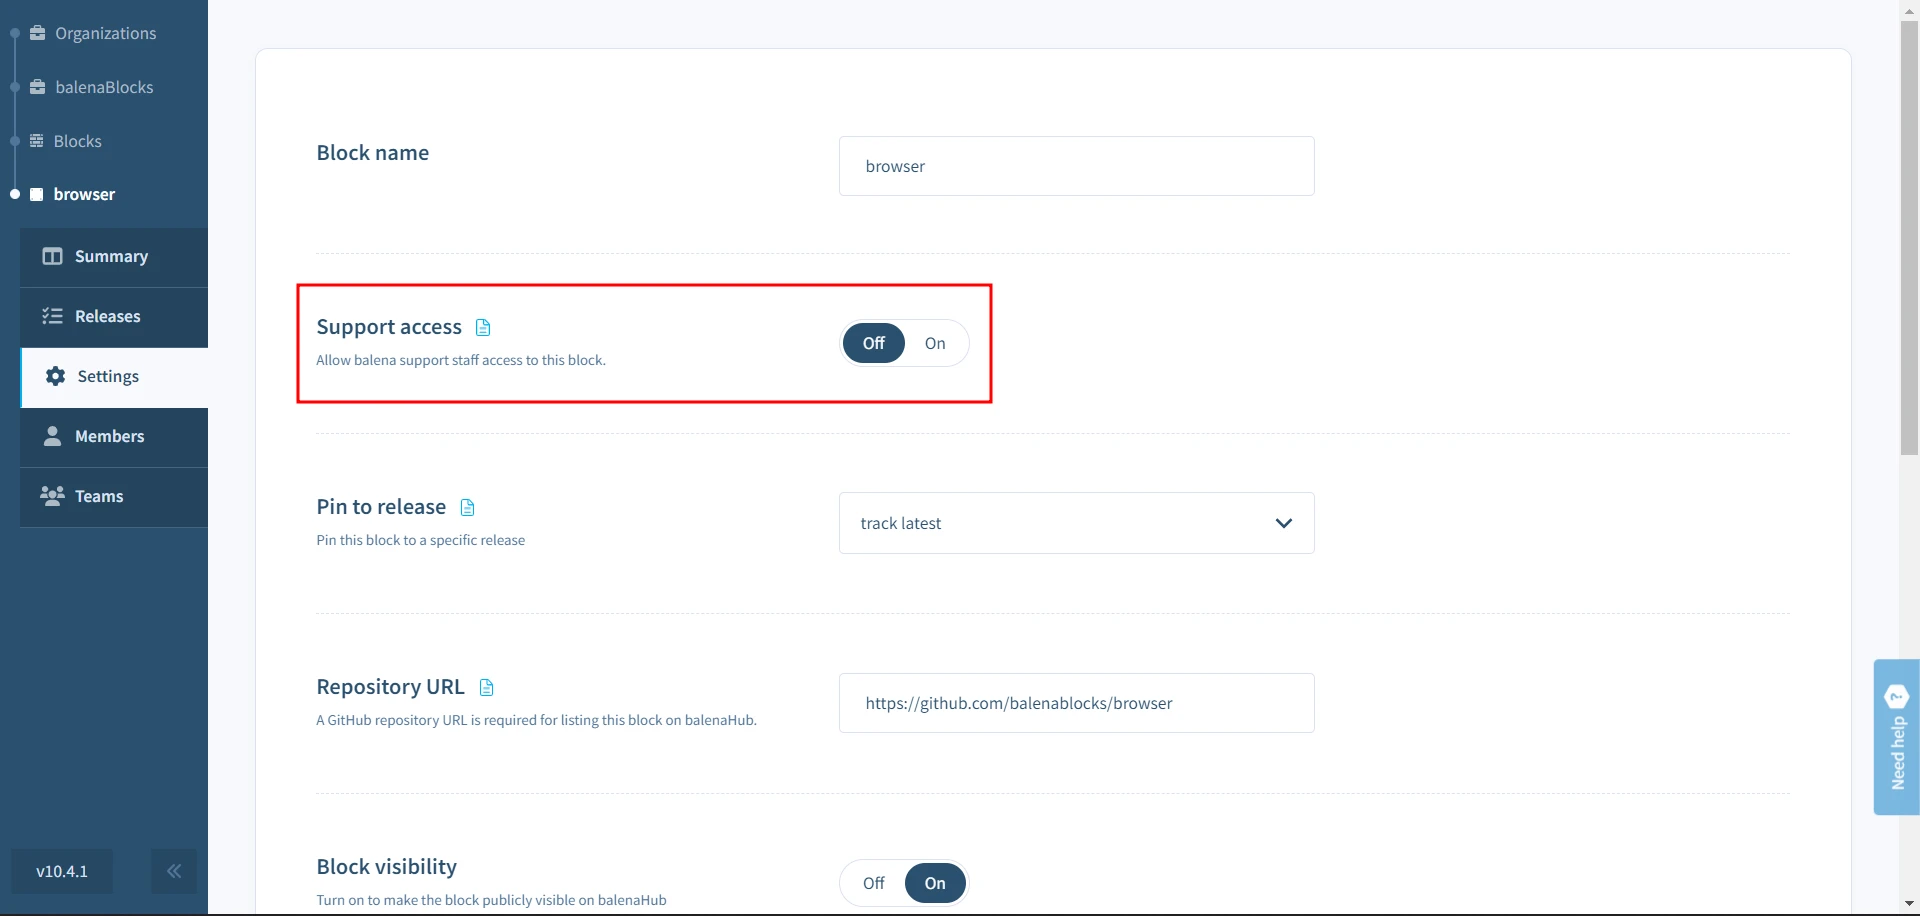
Grant support access for a block
To enable support access for block, select the Grant Support Access from the Settings menu of the block dashboard, and choose the period to grant access. This may be revoked at any time by selecting Revoke Support Access on the same page.
Grant support access using the CLI
To grant or revoke support access for devices or fleets, use the balena support <action> command. Refer to CLI Support access docs for more information.
2. Initial Diagnosis
The balenaCloud Dashboard includes the ability to run diagnostics on a device to determine its current condition. This should be the first step in attempting to diagnose an issue without having to actually access the device via SSH. Ensuring diagnostics and health checks are examined first ensures that you have a good idea of the state a device is in before SSHing into it, as well as ensuring that the information can be accessed later if required (should a device be in a catastrophic state). This helps significantly in a support post-mortem should one be required.
2.1 Device Health Checks
To run health checks through balenaCloud dashboard, head to the Diagnostics tab in the sidebar and click the Run checks button to start the tests.

This will trigger a set of health checks to run on the device. You should see all the checks as Succeeded in the Success column if the device is healthy and there are no obvious faults.
That's no fun, let's create a fault.
SSH into your device, via balena ssh <UUID>, using the appropriate UUID. We want to
SSH into the host OS, as that's where we'll wreak havoc:
$ balena ssh 9294512
=============================================================
    Welcome to balenaOS
=============================================================
root@9294512:~#
We're going to do a couple of things that will show up as problems. Something you'll often check, and that we'll discuss later, is the state of the balena Supervisor and balenaEngine.
First of all, we're going to kill the balenaEngine maliciously without letting it shut down properly:
root@9294512:~# ps aux | awk '!/awk/ && /balenad/ {print $2}' | xargs kill -9What this does is list the processes running, look for the balenad executable
(the balenaEngine itself) and then stop the engine with a SIGKILL signal,
which will make it immediately terminate instead of shutting down correctly.
In fact, we'll do it twice. Once you've waited about 30 seconds, run the command
again.
Now if you run the health checks again. After a couple minutes, you'll see the 'check_container_engine` section has changed:
| Check | Status | Notes |
|---|---|---|
| check_container_engine | Failed | Some container_engine issues detected: |
| test_container_engine_running_now Container engine balena is NOT running | ||
| test_container_engine_restarts Container engine balena has 2 restarts and may be crashlooping (most recent start time: Thu 2022-08-18 11:14:32 UTC) | ||
| test_container_engine_responding Error querying container engine: |
Unclean restarts usually mean that the engine crashed abnormally with an issue.
This usually happens when something catastrophic occurs between the Supervisor
and balenaEngine or corruption occurs in the image/container/volume store.
Let's take a look at the journal for balenaEngine (balena.service) on the
device:
root@9294512:~# journalctl --no-pager -n 400 -u balena.serviceYou'll see a lot of output, as the logs don't just show the balenaEngine output but the output from the Supervisor as well. However, if you search through the output, you'll see a line like the following:
Aug 18 11:14:32 9294512 systemd[1]: balena.service: Main process exited, code=killed, status=9/KILLAs you can see, the balena.service was killed with a SIGKILL instruction.
You can also see the two times that our services were attempted to start after the engine was killed and restarted automatically by running:
root@7db55ce:~# journalctl --no-pager -n 400 -u balena.service | grep frontend -A 5
...
Aug 18 11:15:05 9294512 89fe7a71a40d[6061]: > [email protected] start /usr/src/app
Aug 18 11:15:05 9294512 89fe7a71a40d[6061]: > node index.js
Aug 18 11:15:05 9294512 89fe7a71a40d[6061]:
Aug 18 11:15:06 9294512 422820756f15[6061]:
Aug 18 11:15:06 9294512 422820756f15[6061]: > [email protected] start /usr/src/app
Aug 18 11:15:06 9294512 422820756f15[6061]: > node index.js
As you can see, these have now been specifically output for the two running service containers.
If you only want to see balenaEngine output and not from any of the service
containers it is running, use journalctl -u balena.service -t balenad. The
-t is the shortened form of --identifier=<id>, which in this case ensures
that only messages from the balenad syslog identifier are shown.
We'll discuss issues with balenaEngine and the Supervisor later in this masterclass.
There are many other health checks that can immediately expose a problem. For example, warnings on low free memory or disk space can expose problems which will exhibit themselves as release updates failing to download, or service containers restarting abnormally (especially if a service runs unchecked and consumes memory until none is left). We'll also go through some of these scenarios later in this masterclass.
Checkout the Diagnostics page for more information on tests you can run on the device.
3. Device Access Responsibilities
When accessing a customer's device you have a number of responsibilities, both technically and ethically. A customer assumes that the support agent has a level of understanding and competence, and as such support agents should ensure that these levels are met successfully.
There are some key points which should be followed to ensure that we are never destructive when supporting a customer:
- Always ask permission before carrying out non-read actions. This includes situations such as stopping/restarting/starting services which are otherwise functional (such as the Supervisor). This is especially important in cases where this would stop otherwise functioning services (such as stopping balenaEngine).
- Ensure that the customer is appraised of any non-trivial non-read actions that you are going to take before you carry those actions out on-device. If they have given you permission to do 'whatever it takes' to get the device running again, you should still pre-empt your actions by communicating this clearly.
- During the course of carrying out non-read actions on a device, should the customer be required to answer a query before being able to proceed, make it clear to them what you have already carried out, and that you need a response before continuing. Additionally ensure that any incoming agents that may need to access the device have all of your notes and actions up to this point, so they can take over in your stead.
- Never reboot a device without permission, especially in cases where it appears that there is a chance that the device will not recover (which may be the case in situations where the networking is a non-optimal state). It is imperative in these cases that the customer is made aware that this could be an outcome in advance, and that they must explicitly give permission for a reboot to be carried out.
Occasionally it becomes very useful to copy files off from a device, so that they can be shared with the team. This might be logfiles, or the Supervisor database, etc.
A quick way of copying data from a device with a known UUID onto a local machine is to use SSH with your balena support username:
ssh -o LogLevel=ERROR -o StrictHostKeyChecking=no -o UserKnownHostsFile=/dev/null -p 22 ${USER}@ssh.balena-devices.com host -s ${UUID} 'cat ${PATH_TO_FILE}' > ${LOCAL_PATH}You can copy data from your local machine onto a device by piping the file in instead:
ssh -o LogLevel=ERROR -o StrictHostKeyChecking=no -o UserKnownHostsFile=/dev/null -p 22 ${USER}@ssh.balena-devices.com host -s ${UUID} 'cat > ${PATH_TO_FILE}' < ${LOCAL_PATH}4. Accessing a Device using a Gateway Device
It may not always be possible to access the device directly, especially if the the VPN component isn't working.
Usually, we're able to stay connected to the device when the OpenVPN service isn't running because we're using a development image, and development images allow passwordless root connections via SSH. Had we been running a production image, then the device would have been in the 'Offline' state, but it would still potentially have had network access and be otherwise running correctly. This brings up an issue though, how can we connect to a faulty production device in the field?
The answer comes from the mechanism behind how SSH is tunneled through the VPN, and we can actually use another device (in the 'Online' state) on the same local network as an 'Offline' device to do this.
You will need UUIDs of both the gateway ('Online') and target ('Offline') devices, as well as your username and, if possible, the IP address of the target device (by default, the last seen 'Online' state IP address will be used if the IP is not passed). Once you have these details, you can carry this out by executing the following on your host machine:
$ ssh -t \
   -o LogLevel=ERROR \
   -p 22 [email protected] hostvia $UUID_GATEWAY $UUID_TARGET [$IPADDR]
Should this not work, it's possible that the IP address has changed (and if it has, you will need to specify the correct address). To find the potentially correct IP address is to SSH into the gateway device and run the following script (which should work for both legacy DropBear SSH daemons and those running on more recent balenaOS installations):
( prefix=192.168.1; \
    for i in {2..254}; \
    do \
        addr=$prefix.$i; \
        curl -s -m 1 $addr:22222 --http0.9 | grep -q "SSH-2.0" && echo $addr BALENA DEVICE || echo $addr; \
     done \
)
Ensure you change the prefix variable to the correct prefix for the local
network before starting. This script will then go through the range $prefix.2
to $prefix.254, and flag those devices it believes are potential balena
devices. This should help you narrow down the address range to try connections
to balena devices, substituting the IP address appropriately in the SSH
connection command.
All IP addresses will be printed by the script, but those
that are potentially balena devices will show up with BALENA DEVICE next to
them. If you have multiple potential UUIDs, you'll need to mix and match UUIDs
and IP addresses until you find a matching combination.
You may also try using mDNS from the gateway device to locate the IP of the
target based on its hostname. Simply ping the .local address and grab the IP
that way:
root@9294512:~# ping -c1 $(hostname).local
PING 9294512.local (172.17.0.1): 56 data bytes
64 bytes from 172.17.0.1: seq=0 ttl=64 time=0.400 ms

--- 9294512.local ping statistics ---
1 packets transmitted, 1 packets received, 0% packet loss
round-trip min/avg/max = 0.400/0.400/0.400 ms
...
5. Component Checklist
The key to any support is context. As a support agent, you should have enough context from a customer to start an investigation. If you do not, then you should ask for as much context and detail about the device as you can before starting an investigation on the device.
When accessing a device, there are usually some things you can check to see why a device may be in a broken state. Obviously, this depends on the symptoms a customer has reported, as well as those a support agent may have found when running the device diagnostics. However, there are some common issues that can occur to put a device into a broken state that can be quickly fixed.
The following sections discuss some of the first components to check when carrying out on-device support. The components that should be checked and in what order comes down to the context of support, and the symptoms seen.
5.1 Service Status and Journal Logs
balenaOS uses systemd as its init system, and as such almost all the fundamental components in balenaOS run as systemd services. systemd builds a dependency graph of all of its unit files (in which services are defined) to determine the order that these should be started/shutdown in. This is generated when systemd is run, although there are ways to rebuild this after startup and during normal system execution.
Possibly the most important command is journalctl, which allows you to read
the service's journal entries. This takes a variety of switches, the most
useful being:
--follow/-f- Continues displaying journal entries until the command is halted (eg. with Ctrl-C)--unit=<unitFile>/-u <unitFile>- Specifies the unit file to read journal entries for. Without this, all units entries are read.--pager-end/-e- Jump straight to the final entries for a unit.--all/-a- Show all entries, even if long or with unprintable characters. This is especially useful for displaying the service container logs from user containers when applied tobalena.service.
A typical example of using journalctl might be following a service to see
what's occuring. Here's it for the Supervisor, following journal entries in
real time:
root@9294512:~# journalctl --follow --unit=balena-supervisor
-- Journal begins at Fri 2021-08-06 14:40:59 UTC. --
Aug 18 16:56:55 9294512 balena-supervisor[6890]: [info]    Reported current state to the cloud
Aug 18 16:57:05 9294512 balena-supervisor[6890]: [info]    Reported current state to the cloud
Aug 18 16:58:17 9294512 balena-supervisor[6890]: [info]    Reported current state to the cloud
Aug 18 16:58:27 9294512 balena-supervisor[6890]: [info]    Reported current state to the cloud
Aug 18 16:58:37 9294512 balena-supervisor[6890]: [info]    Reported current state to the cloud
Aug 18 16:58:48 9294512 balena-supervisor[6890]: [info]    Reported current state to the cloud
Aug 18 16:58:58 9294512 balena-supervisor[6890]: [info]    Reported current state to the cloud
Aug 18 16:59:19 9294512 balena-supervisor[6890]: [info]    Reported current state to the cloud
Aug 18 16:59:40 9294512 balena-supervisor[6890]: [info]    Reported current state to the cloud
Aug 18 17:00:00 9294512 balena-supervisor[6890]: [info]    Reported current state to the cloud
Any systemd service can be referenced in the same way, and there are some common commands that can be used with services:
systemctl status <serviceName>- Will show the status of a service. This includes whether it is currently loaded and/or enabled, if it is currently active (running) and when it was started, its PID, how much memory it is notionally (and beware here, this isn't always the amount of physical memory) using, the command used to run it and finally the last set of entries in its journal log. Here's example output from the OpenVPN service:
5.2 Persistent Logs
Device logging and the storage of device logs in balenaCloud is designed to be a debugging feature for balena devices. The Logs section in the balenaCloud dashboard can be used to view and download logs from the system and app services running on the device in real-time.
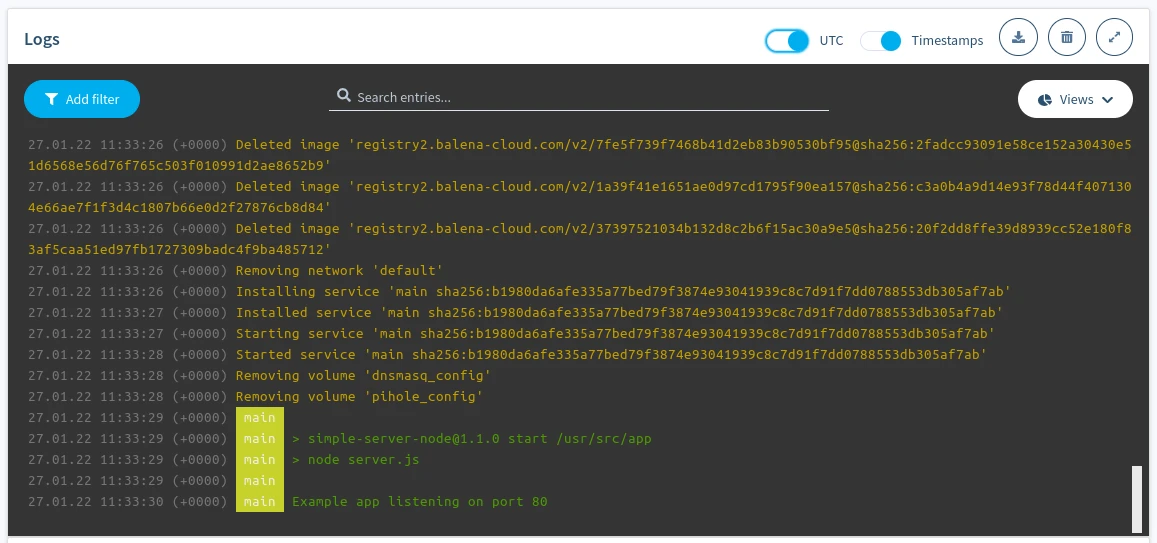
Device logs on the balenaCloud dashboard
Device logs contain anything written to stdout and stderr of app services and the system logs of the device. The dashboard allows logs to be cleared, filtered, searched, and viewed according to the browser timezone (or UTC).
The maximum limit of logs displayed on the dashboard is 1000 lines. This is also the amount of logs stored in the API and available for download. Device logging in balenaCloud isn't meant for long-term, reliable storage of logs. It's instead designed to provide the latest logs from the device for debugging purposes. We plan to expand our logging solution to offer long-term storage and search.
Persistent logging
The ability to read logs from the different system services running in balenaOS is vital in tracking issues. On reboot, these journal logs are cleared, and so examining them will not, for example, give any insight as to why the reboot may have occurred (or which services may have failed, causing a reboot). To alleviate this, balenaOS allows persistent journals (logs). Persistent logs provide vital insight into checking why a reboot occurred and help make debugging easier.
Persistent logging can be enabled using the Configuration tab on the sidebar for either a specific device or fleet-wide. Select 'Activate' to enable persistent logging on a specific device or on all devices in a fleet.
Since logs are stored in the data partition of the hostOS, the device(s) will reboot to activate persistent logging and apply the related settings.
Once persistent logging is enabled, the logs are stored as part of the data partition on the device (either on SD card, eMMC, hard disk, etc.). Logs are located on-device at /var/log/journal/<uuid>,where <uuid> matches the contents of the /etc/machine-id and is not related with the balena device UUID.
Journals can be read like those for any unit file, using journalctl, although the flags passed to the command are slightly different. Here's an example of how to read persistent journals:
root@dee2945:~# cd /var/log/journal/b9ccd869194e4f1381c06967f99b0265/
root@dee2945:/var/log/journal/b9ccd869194e4f1381c06967f99b0265# ls -l
total 2051
-rw-r----- 1 root root 1048576 Jan 13 11:05 system.journal
-rw-r----- 1 root root 1048576 Jan 13 11:05 system@2ad94f188fb64c2da9803557662b57b2-0000000000000001-00058b3468ac9625.journal
root@dee2945:/var/log/journal/b9ccd869194e4f1381c06967f99b0265# journalctl -a --file system.journal
-- Logs begin at Mon 2020-01-13 11:05:06 UTC, end at Mon 2020-01-13 11:05:37 UTC. --
Jan 13 11:05:06 dee2945 systemd-journald[490]: Time spent on flushing to /var is 65.151ms for 795 entries.
Jan 13 11:05:06 dee2945 systemd-journald[490]: System journal (/var/log/journal/b9ccd869194e4f1381c06967f99b0265) is 2.0M, max 8.0M, 5.9M free.
Jan 13 11:05:07 dee2945 systemd[1]: Started Resin persistent logs.
Jan 13 11:05:07 dee2945 resin-persistent-logs[670]: resin-persistent-logs: Persistent logging activated.
Jan 13 11:05:06 dee2945 kernel[664]: [   14.553592] systemd-journald[490]: Received request to flush runtime journal from PID 1
Jan 13 11:05:07 dee2945 systemd[1]: Started Modem Manager.
Jan 13 11:05:07 dee2945 NetworkManager[740]: <info>  [1578913507.2694] NetworkManager (version 1.18.0) is starting... (for the first time)
Jan 13 11:05:07 dee2945 NetworkManager[740]: <info>  [1578913507.2698] Read config: /etc/NetworkManager/NetworkManager.conf (etc: os-networkmanager.conf)
Jan 13 11:05:07 dee2945 systemd[1]: Started Network Manager.
Jan 13 11:05:07 dee2945 NetworkManager[740]: <info>  [1578913507.2862] bus-manager: acquired D-Bus service "org.freedesktop.NetworkManager"
Jan 13 11:05:07 dee2945 systemd[1]: Reached target Network.
Jan 13 11:05:07 dee2945 systemd[1]: Started OpenVPN.
Jan 13 11:05:07 dee2945 systemd[1]: Starting Resin init service...
Jan 13 11:05:07 dee2945 systemd[1]: Starting DNS forwarder and DHCP server...
Jan 13 11:05:07 dee2945 systemd[1]: Started OS configuration update service.
Jan 13 11:05:07 dee2945 NetworkManager[740]: <info>  [1578913507.3047] manager[0x12ec000]: monitoring kernel firmware directory '/lib/firmware'.
Jan 13 11:05:07 dee2945 bash[758]: Board specific initialization...
Jan 13 11:05:07 dee2945 dnsmasq[759]: dnsmasq: syntax check OK.
Jan 13 11:05:07 dee2945 systemd[1]: Started DNS forwarder and DHCP server.
Jan 13 11:05:07 dee2945 systemd[1]: Starting Balena Application Container Engine...
Jan 13 11:05:07 dee2945 systemd[1]: Starting Resin proxy configuration service...
Jan 13 11:05:07 dee2945 dnsmasq[763]: dnsmasq[763]: started, version 2.78 cachesize 150
Jan 13 11:05:07 dee2945 dnsmasq[763]: dnsmasq[763]: compile time options: IPv6 GNU-getopt DBus no-i18n no-IDN DHCP DHCPv6 no-Lua TFTP no-conntrack ipset auth no-DNSSEC >
Jan 13 11:05:07 dee2945 dnsmasq[763]: dnsmasq[763]: DBus support enabled: connected to system bus
Jan 13 11:05:07 dee2945 dnsmasq[763]: dnsmasq[763]: reading /etc/resolv.dnsmasq
Jan 13 11:05:07 dee2945 dnsmasq[763]: dnsmasq[763]: using nameserver 8.8.8.8#53
Jan 13 11:05:07 dee2945 dnsmasq[763]: dnsmasq[763]: read /etc/hosts - 6 addresses
Jan 13 11:05:07 dee2945 dnsmasq[763]: dnsmasq[763]: using nameserver 8.8.8.8#53
Jan 13 11:05:07 dee2945 kernel: i2c /dev entries driver
Jan 13 11:05:07 dee2945 kernel[664]: [   14.974497] i2c /dev entries driver
Increasing size of persistent logs store
Depending on the OS version, the size of persistent logs can be increased to store more logs than the default size (32 MB currently). This can be done by adjusting the SystemMaxUse= setting in /etc/systemd/journald.conf.d/journald-balena-os.conf (refer to journald.conf docs for more information). Mistakes in the configuration can cause hard-to-solve problems, hence we recommend testing the changes on development test devices first.
We consider changes to the size of persistent log store to be a temporary debugging tool, not a long-term solution. In particular, changes made to journald-balena-os.conf will be overwritten when balenaOS is updated.
Do keep in mind persistent logging increases the wear on the storage medium due to increased writes. Refer to long term storage of device logs for ways to offset this.
Long term device logs storage
If you are dealing with excessive logs, persistent logging might not be a reliable long-term solution. Persistent logging increases writes on the device's storage media, which results in higher wear and tear over time.
Instead, device logs can be streamed using the supervisor API. Refer to the Supervisor's journald endpoint. Through this endpoint, device logs can be streamed to whichever cloud monitoring platform you use to store logs reliably over time. For example, using a solution like Datadog.
6. Determining Networking Issues
There are some common networking issues that can stop several major components (VPN, Supervisor, balenaEngine) from working correctly.
The first thing to check would be confirming if the networking requirements are being met.
Additionally, services running on the device themselves may have networking requirements which may not be met. For example, a service may need to send data to a server, but the server is offline and unreachable, and maybe the service isn't designed to handle these failures.
In general, debugging networking issues also gets easier the more you experiment with making changes to networking interfaces and routes on a device. The following sections describe some of the more common network failure modes, as well as how to track them down. Be aware that several of these problems may also occur at the same time, with one problem causing others to appear. For example, NTP failure could stop the date from being correct, which can lead to the VPN failing to connect (as the certificate is probably not yet date-valid) as well as the Supervisor failing to download updates (for the same reason).
6.1 NTP Failure
Service: chronyd.service
CLI: chronyc
Network Time Protocol is important because it allows devices without RTCs (Real-Time Clocks) to retrieve the correct date and time from Internet based servers that run on an extremely fine granularity. At first glance, this may not seem significant, but devices such as the Raspberry Pi do not include an RTC and so when balenaOS is first booted, it sets the time when the release of the OS was built. Clearly, this could be days, weeks, months or even years behind the current time. Because almost all the balena services that work with applications work with balenaCloud endpoints, it is extremely important that the date and time be set correctly, else SSL-based connections (including HTTPS connections) will be rejected because the certificates presented will appear to be date invalid when compared to the system clock.
Depending on how skewed the device date is from the real date, this can manifest as several different issues:
- Refusal to connect to the balenaCloud VPN
- Refusal to download configuration from the API
- Refusal by the Supervisor to download the latest release
Examining the status of the chronyd service can show these symptoms, along
with the simple date command:
root@9294512:~# date
Fri Aug 19 09:11:43 UTC 2022
If the date reported by the device differs to the current date and time, then there is most probably a problem with the time service.
Before continuing with this exercise, reboot or power down/power up and wait for it to come online before SSHing into it.
Ensure you know the local IP address of the debug device (or use balena scan
to find the hostname of your device), and SSH into it like this (where
10.0.0.197 is the IP address of your device, or <host>.local name):
$ balena ssh 10.0.0.197
Last login: Fri Aug 19 09:09:37 2022
root@9294512:~#
Your device should be connected, bring up the Dashboard page for the device. It should be 'Online' and running the pushed release code.
We'll demonstrate an NTP failure by making some manual changes to the date:
root@9294512:~# date -s "23 MAR 2017 12:00:00"
Thu Mar 23 12:00:00 UTC 2017
root@9294512:~# systemctl restart openvpn
Almost immediately, you'll see that the device status moves to 'Online (Heartbeat only)'. So, why has this happened? Wait until the device comes back online, then ssh back in and take a look in the OpenVPN logs:
root@9294512:~# journalctl --follow -n 300 -u openvpn.service
-- Journal begins at Thu 2017-03-23 12:00:02 UTC. --
Mar 23 12:00:24 9294512 openvpn[135086]: Thu Mar 23 12:00:24 2017 Attempting to establish TCP connection with [AF_INET]34.226.166.12:443 [nonblock]
Mar 23 12:00:25 9294512 openvpn[135086]: Thu Mar 23 12:00:25 2017 TCP connection established with [AF_INET]34.226.166.12:443
Mar 23 12:00:25 9294512 openvpn[135086]: Thu Mar 23 12:00:25 2017 TCP_CLIENT link local: (not bound)
Mar 23 12:00:25 9294512 openvpn[135086]: Thu Mar 23 12:00:25 2017 TCP_CLIENT link remote: [AF_INET]34.226.166.12:443
Mar 23 12:00:25 9294512 openvpn[135086]: Thu Mar 23 12:00:25 2017 TLS: Initial packet from [AF_INET]34.226.166.12:443, sid=416e63eb ed87172e
Mar 23 12:00:25 9294512 openvpn[135086]: Thu Mar 23 12:00:25 2017 VERIFY ERROR: depth=1, error=certificate is not yet valid: C=US, ST=WA, L=Seattle, O=balena.io, OU=balenaCloud, CN=open-balena-vpn-rootCA
Mar 23 12:00:25 9294512 openvpn[135086]: Thu Mar 23 12:00:25 2017 OpenSSL: error:1416F086:SSL routines:tls_process_server_certificate:certificate verify failed
Mar 23 12:00:25 9294512 openvpn[135086]: Thu Mar 23 12:00:25 2017 TLS_ERROR: BIO read tls_read_plaintext error
Mar 23 12:00:25 9294512 openvpn[135086]: Thu Mar 23 12:00:25 2017 TLS Error: TLS object -> incoming plaintext read error
Mar 23 12:00:25 9294512 openvpn[135086]: Thu Mar 23 12:00:25 2017 TLS Error: TLS handshake failed
Mar 23 12:00:25 9294512 openvpn[135086]: Thu Mar 23 12:00:25 2017 Fatal TLS error (check_tls_errors_co), restarting
Mar 23 12:00:25 9294512 openvpn[135086]: Thu Mar 23 12:00:25 2017 SIGUSR1[soft,tls-error] received, process restarting
Mar 23 12:00:25 9294512 openvpn[135086]: Thu Mar 23 12:00:25 2017 Restart pause, 5 second(s)
Mar 23 12:00:30 9294512 openvpn[135086]: Thu Mar 23 12:00:30 2017 NOTE: the current --script-security setting may allow this configuration to call user-defined scripts
Mar 23 12:00:30 9294512 openvpn[135086]: Thu Mar 23 12:00:30 2017 TCP/UDP: Preserving recently used remote address: [AF_INET]3.225.166.106:443
Mar 23 12:00:30 9294512 openvpn[135086]: Thu Mar 23 12:00:30 2017 Socket Buffers: R=[131072->131072] S=[16384->16384]
There's a bit to wade through here, but the first line shows the OpenVPN
successfully finalizing a connection to the balenaCloud VPN backend. However,
we then see our manual restart of the openvpn.service unit file
(Mar 23 12:00:06 9294512 openvpn[2639]: Thu Mar 23 12:00:06 2017 SIGTERM[hard,] received, process exiting)
and then it starting up again. But whilst it initializes, you'll note that
whilst trying to connect it found a problem in the verification stage:
Aug 18 10:51:45 9294512 openvpn[2639]: Thu Aug 18 10:51:45 2022 VERIFY OK: depth=0, C=US, ST=WA, L=Seattle, O=balena.io, OU=balenaCloud, CN=vpn.balena-cloud.com
Mar 23 12:00:07 9294512 openvpn[135086]: Thu Mar 23 12:00:07 2017 VERIFY ERROR: depth=1, error=certificate is not yet valid: C=US, ST=WA, L=Seattle, O=balena.io, OU=balenaCloud, CN=open-balena-vpn-rootCA
Mar 23 12:00:07 9294512 openvpn[135086]: Thu Mar 23 12:00:07 2017 OpenSSL: error:1416F086:SSL routines:tls_process_server_certificate:certificate verify failed
The certificate that it fetched from the balenaCloud VPN service is not yet valid. This is because SSL certificates have "valid from" and "valid to" dates. These ensure that they can only be used in a particular time window, and if the current time falls outside of that window then any connection using them is invalid. In this case, because we've set the time back to 2017, the date doesn't fall within that window and the connection is aborted by the client.
But if the date is incorrect, why has the device reconnected? Run the following on the device:
root@9294512:~# date
Fri Aug 19 09:25:45 UTC 2022
So the date's actually now correct. This is because the NTP service
(chronyd.service) has eventually noticed that there's a mismatch in the
set time on the device, and the time from one of it's sources. Let's look at
the journal for it:
root@9294512:~# journalctl --no-pager -u chronyd.service
Aug 18 10:51:01 9294512 healthdog[2011]: 2022-08-18T10:51:01Z chronyd version 4.0 starting (+CMDMON +NTP +REFCLOCK +RTC -PRIVDROP -SCFILTER -SIGND +ASYNCDNS -NTS -SECHASH +IPV6 -DEBUG)
Mar 23 12:01:09 9294512 healthdog[2011]: 2017-03-23T12:01:09Z Backward time jump detected!
Mar 23 12:01:09 9294512 healthdog[2011]: 2017-03-23T12:01:09Z Cannot synchronize: no selectable sources
Mar 23 12:01:19 9294512 healthdog[135156]: [chrony-healthcheck][INFO] No online NTP sources - forcing poll
Mar 23 12:01:19 9294512 healthdog[2011]: 2017-03-23T12:01:19Z System clock was stepped by -0.000000 seconds
Mar 23 12:01:25 9294512 healthdog[2011]: 2017-03-23T12:01:25Z Selected source 198.199.14.101 (0.resinio.pool.ntp.org)
Mar 23 12:01:25 9294512 healthdog[2011]: 2017-03-23T12:01:25Z System clock wrong by 170630052.229025 seconds
Aug 19 09:15:37 9294512 healthdog[2011]: 2022-08-19T09:15:37Z System clock was stepped by 170630052.229025 seconds
As you can see, it selected a source and set the time back to the correct current time. This had a knock on effect, in that the openvpn service (VPN/cloudlink) reattempted to connect to the backend:
root@9294512:~# journalctl -f -n 100 -u openvpn
Mar 23 12:01:21 9294512 openvpn[135086]: Thu Mar 23 12:01:21 2017 Fatal TLS error (check_tls_errors_co), restarting
Mar 23 12:01:21 9294512 openvpn[135086]: Thu Mar 23 12:01:21 2017 SIGUSR1[soft,tls-error] received, process restarting
Mar 23 12:01:21 9294512 openvpn[135086]: Thu Mar 23 12:01:21 2017 Restart pause, 5 second(s)
Aug 19 09:15:39 9294512 openvpn[135086]: Fri Aug 19 09:15:39 2022 NOTE: the current --script-security setting may allow this configuration to call user-defined scripts
Aug 19 09:15:39 9294512 openvpn[135086]: Fri Aug 19 09:15:39 2022 TCP/UDP: Preserving recently used remote address: [AF_INET6]2600:1f18:6600:7f02:bda3:7af0:e21:425b:443
Aug 19 09:15:39 9294512 openvpn[135086]: Fri Aug 19 09:15:39 2022 Socket Buffers: R=[131072->131072] S=[16384->16384]
Aug 19 09:15:39 9294512 openvpn[135086]: Fri Aug 19 09:15:39 2022 Attempting to establish TCP connection with [AF_INET6]2600:1f18:6600:7f02:bda3:7af0:e21:425b:443 [nonblock]
Aug 19 09:15:40 9294512 openvpn[135086]: Fri Aug 19 09:15:40 2022 TCP connection established with [AF_INET6]2600:1f18:6600:7f02:bda3:7af0:e21:425b:443
Aug 19 09:15:40 9294512 openvpn[135086]: Fri Aug 19 09:15:40 2022 TCP_CLIENT link local: (not bound)
Aug 19 09:15:40 9294512 openvpn[135086]: Fri Aug 19 09:15:40 2022 TCP_CLIENT link remote: [AF_INET6]2600:1f18:6600:7f02:bda3:7af0:e21:425b:443
Aug 19 09:15:40 9294512 openvpn[135086]: Fri Aug 19 09:15:40 2022 TLS: Initial packet from [AF_INET6]2600:1f18:6600:7f02:bda3:7af0:e21:425b:443, sid=b355e635 6170b76f
Aug 19 09:15:40 9294512 openvpn[135086]: Fri Aug 19 09:15:40 2022 VERIFY OK: depth=1, C=US, ST=WA, L=Seattle, O=balena.io, OU=balenaCloud, CN=open-balena-vpn-rootCA
Aug 19 09:15:40 9294512 openvpn[135086]: Fri Aug 19 09:15:40 2022 VERIFY KU OK
Aug 19 09:15:40 9294512 openvpn[135086]: Fri Aug 19 09:15:40 2022 Validating certificate extended key usage
Aug 19 09:15:40 9294512 openvpn[135086]: Fri Aug 19 09:15:40 2022 ++ Certificate has EKU (str) TLS Web Server Authentication, expects TLS Web Server Authentication
Aug 19 09:15:40 9294512 openvpn[135086]: Fri Aug 19 09:15:40 2022 VERIFY EKU OK
Aug 19 09:15:40 9294512 openvpn[135086]: Fri Aug 19 09:15:40 2022 VERIFY OK: depth=0, C=US, ST=WA, L=Seattle, O=balena.io, OU=balenaCloud, CN=vpn.balena-cloud.com
This time the connection has been verified and the device has come online. This
shows what might have happened if someone had manually set the date, but what
happens if it doesn't recover? This is a good example of where the NTP port
might have been blocked, so that the device couldn't sync it's time. It might
also be possible that the chronyd.service unit may have crashed or stopped
for some reason, and restarting it would solve the issue.
Changes such as this don't just affect the online status of the device. Let's stop the chrony service completely (so it can't correctly resync the time) and change the date again:
root@9294512:~# systemctl stop chronyd.service
root@9294512:~# date -s "23 MAR 2017 12:00:00"
Now from your development machine, again push the source code from the
multicontainer-app directory:
$ balena push DebugFleetOnce the build has completed, the device should try and download the updated release. However, you'll notice that the download doesn't start and no changes are made. The Dashboard stays static. Why is this? Well as you've probably guessed, it's for the same reasons that the VPN connection doesn't work. Run the following on your device:
root@9294512:~# journalctl -n 100 --no-pager -u balena-supervisor
-- Journal begins at Thu 2017-03-23 12:00:00 UTC, ends at Fri 2022-08-19 09:33:22 UTC. --
Aug 19 07:25:20 9294512 balena-supervisor[6890]: [debug]   Attempting container log timestamp flush...
Aug 19 07:25:20 9294512 balena-supervisor[6890]: [debug]   Container log timestamp flush complete
Aug 19 07:27:06 9294512 balena-supervisor[6890]: [api]     GET /v1/healthy 200 - 3.025 ms
Mar 23 12:00:02 9294512 balena-supervisor[6890]: [info]    Retrying current state report in 15 seconds
Mar 23 12:00:02 9294512 balena-supervisor[6890]: [event]   Event: Device state report failure {"error":"certificate is not yet valid"}
Mar 23 12:00:06 9294512 balena-supervisor[6890]: [info]    VPN connection is not active.
As you can see, the certificate is again not valid as the current device time does not fall within the validity window, and so the Supervisor won't pull the latest release. If we restart chrony, this will be rectified and the Supervisor will, after a short delay, start the update:
root@9294512:~# systemctl start chronyd.service
root@9294512:~# journalctl -f -u balena-supervisor
-- Journal begins at Thu 2017-03-23 12:00:20 UTC. --


Mar 23 12:04:08 9294512 balena-supervisor[6890]: [info]    Retrying current state report in 240 seconds
Mar 23 12:04:08 9294512 balena-supervisor[6890]: [event]   Event: Device state report failure {"error":"certificate is not yet valid"}
Aug 19 09:55:20 9294512 balena-supervisor[6890]: [debug]   Attempting container log timestamp flush...
Aug 19 09:55:20 9294512 balena-supervisor[6890]: [debug]   Container log timestamp flush complete
Aug 19 09:55:41 9294512 balena-supervisor[6890]: [api]     GET /v1/device 200 - 24.495 ms
Aug 19 09:55:55 9294512 balena-supervisor[6890]: [info]    Reported current state to the cloud
Aug 19 09:56:48 9294512 balena-supervisor[6890]: [info]    Applying target state
Aug 19 09:56:49 9294512 balena-supervisor[6890]: [event]   Event: Image removal {"image":{"name":"registry2.balena-cloud.com/v2/876c57f4b5dde80de9b0d01e325bcbfe@sha256:6ebc43e800b347004ec6945806b12d4111a2450f63544366c9961fab0caac2cd","appId":1958513,"serviceId":1706634,"serviceName":"backend","imageId":5298767,"releaseId":2265189,"dependent":0,"appUuid":"85e44a78a40a4d78ae1243caca2424dc","commit":"4101191493a1ffc54bec9101e045bacf"}}
Aug 19 09:56:49 9294512 balena-supervisor[6890]: [event]   Event: Image removal {"image":{"name":"registry2.balena-cloud.com/v2/e40d992f529b1567b0f2cc63f9fa877a@sha256:45c002b1bb325c1b93ff333a82ff401c9ba55ca7d00118b31a1c992f6fc5a4a4","appId":1958513,"serviceId":1706633,"serviceName":"frontend","imageId":5298766,"releaseId":2265189,"dependent":0,"appUuid":"85e44a78a40a4d78ae1243caca2424dc","commit":"4101191493a1ffc54bec9101e045bacf"}}
Aug 19 09:56:50 9294512 balena-supervisor[6890]: [debug]   Finished applying target state
Aug 19 09:56:50 9294512 balena-supervisor[6890]: [success] Device state apply success
Aug 19 09:56:58 9294512 balena-supervisor[6890]: [info]    Reported current state to the cloud
Aug 19 09:57:20 9294512 balena-supervisor[6890]: [api]     GET /v1/healthy 200 - 4.198 ms
...
This shows the importance of a working service such as timesetting, and how this can affect the system as a whole. As a note, be aware that not every device relies completely on NTP. Some devices, such as an Intel NUC, also have battery backed services including an RTC, which means that even if NTP is not working the time may look at first glance as though it's correct. However, if NTP is not operational even an RTC will eventually suffer from clock skew (the slow movement away from the real time due to drift) which will eventually cause issues.
chronyc is a command-line utility that can be used to interoperate with the
NTP daemon. chronyc has many commands, the most useful are:
sources- A list of all the current NTP sources being used by the NTP daemon.reselect- Forces the NTP daemon to reselect the best time synchronization source.tracking- Information about the system clock itself, including skew.ntpdata- Detailed information on all the current NTP sources.
6.2 DNS Issues
Service: dnsmasq.service
DNS (Domain Name Service) functionality allows the IP address of a hostname to be retrieved for use by anything that uses endpoints on the Internet (that isn't specified by an IP address). Any executable that uses a hostname to make a connection to that host always uses DNS to get the IP address to make that connection.
For this reason, DNS is vital in the reliable operation of a balena device as it
provides the ability to lookup *.balena-cloud.com hostnames to allow the
download of releases, reporting the device state, connection to the VPN,
etc.
DNS is provided by the dnsmasq.service unit, which uses a default
configuration located at /etc/dnsmasq.conf and a list of nameservices
in /etc/resolv.dnsmasq. This itself is derived from the
/var/run/resolvconf/interface/NetworkManager file.
The DNSMasq service runs at local address 127.0.0.2. This is used, because
it allows customer services to provide their own DNS if required
and therefore does not clash with them.
By default, the external name servers used are the Google primary and secondary
at 8.8.8.8 and 8.8.4.4. However, these can be overridden by modifying the
/mnt/boot/config.json file and adding a dnsServers property, with a comma
separated list of the IP addresses of the nameservers to use (see
the docs for more
information).
SSH into your device using it's local IP address:
$ balena ssh 10.0.0.197or using it's UUID:
$ balena ssh 9294512We're going to modify the DNS servers to point at one that doesn't exist, just to show what happens. SSH into your device as above, then run the following:
root@9294512:~# jq '.dnsServers = "1.2.3.4"' /mnt/boot/config.json > /mnt/data/config.json && mv /mnt/data/config.json /mnt/boot/config.json
root@9294512:~# mount -o remount,rw /
root@9294512:~# mv /etc/resolv.dnsmasq /etc/resolv.dnsmasq.moved
root@9294512:~# sync
root@9294512:~# reboot
This will move the default DNSMasq resolver config file, so that it's not
picked up. Additionally, it will modify the configuration to set the nameserver
to use as 1.2.3.4. As this isn't a valid nameserver, nothing will get the
right address to make connections. Note that usually, remounting the root FS
as writeable is a very risky move, and should not be carried out without good
reason!
After a while, once the device has rebooted, SSH back into the device using the local IP address, and look
at the dnsmasq.service unit:
root@9294512:~# systemctl status dnsmasq
● dnsmasq.service - DNS forwarder and DHCP server
     Loaded: loaded (/lib/systemd/system/dnsmasq.service; enabled; vendor preset: enabled)
    Drop-In: /etc/systemd/system/dnsmasq.service.d
             └─dnsmasq.conf
     Active: active (running) since Fri 2022-08-19 10:11:53 UTC; 35s ago
    Process: 1791 ExecStartPre=/usr/bin/dnsmasq --test (code=exited, status=0/SUCCESS)
   Main PID: 1792 (dnsmasq)
      Tasks: 1 (limit: 1878)
     Memory: 344.0K
     CGroup: /system.slice/dnsmasq.service
             └─1792 /usr/bin/dnsmasq -x /run/dnsmasq.pid -a 127.0.0.2,10.114.102.1 -7 /etc/dnsmasq.d/ -r /etc/resolv.dnsmasq -z --servers-file=/run/dnsmasq.servers -k --lo>

Aug 19 10:11:53 9294512 dnsmasq[1791]: dnsmasq: syntax check OK.
Aug 19 10:11:53 9294512 dnsmasq[1792]: dnsmasq[1792]: started, version 2.84rc2 cachesize 150
Aug 19 10:11:53 9294512 dnsmasq[1792]: dnsmasq[1792]: compile time options: IPv6 GNU-getopt DBus no-UBus no-i18n no-IDN DHCP DHCPv6 no-Lua TFTP no-conntrack ipset auth no->
Aug 19 10:11:53 9294512 dnsmasq[1792]: dnsmasq[1792]: DBus support enabled: connected to system bus
Aug 19 10:11:53 9294512 dnsmasq[1792]: dnsmasq[1792]: read /etc/hosts - 6 addresses
Aug 19 10:11:53 9294512 dnsmasq[1792]: dnsmasq[1792]: using nameserver 1.2.3.4#53
Aug 19 10:12:06 9294512 dnsmasq[1792]: dnsmasq[1792]: failed to access /etc/resolv.dnsmasq: No such file or directory
As you can see, it's tried, and failed to get the /etc/resolv.dnsmasq file
and has just the one nameserver to use, 1.2.3.4.
Now let's look at the Supervisor:
root@9294512:~# systemctl status balena-supervisor
● balena-supervisor.service - Balena supervisor
     Loaded: loaded (/lib/systemd/system/balena-supervisor.service; enabled; vendor preset: enabled)
     Active: active (running) since Fri 2022-08-19 10:12:12 UTC; 1min 5s ago
    Process: 2213 ExecStartPre=/usr/bin/balena stop resin_supervisor (code=exited, status=1/FAILURE)
    Process: 2239 ExecStartPre=/usr/bin/balena stop balena_supervisor (code=exited, status=0/SUCCESS)
    Process: 2258 ExecStartPre=/bin/systemctl is-active balena.service (code=exited, status=0/SUCCESS)
   Main PID: 2259 (start-balena-su)
      Tasks: 11 (limit: 1878)
     Memory: 12.4M
     CGroup: /system.slice/balena-supervisor.service
             ├─2259 /bin/sh /usr/bin/start-balena-supervisor
             ├─2261 /proc/self/exe --healthcheck /usr/lib/balena-supervisor/balena-supervisor-healthcheck --pid 2259
             └─2405 balena start --attach balena_supervisor

Aug 19 10:12:19 9294512 balena-supervisor[2405]: [info]    Waiting for connectivity...
Aug 19 10:12:19 9294512 balena-supervisor[2405]: [debug]   Starting current state report
Aug 19 10:12:19 9294512 balena-supervisor[2405]: [debug]   Starting target state poll
Aug 19 10:12:19 9294512 balena-supervisor[2405]: [debug]   Spawning journald with: chroot  /mnt/root journalctl -a --follow -o json _SYSTEMD_UNIT=balena.service
Aug 19 10:12:20 9294512 balena-supervisor[2405]: [debug]   Finished applying target state
Aug 19 10:12:20 9294512 balena-supervisor[2405]: [success] Device state apply success
Aug 19 10:12:34 9294512 balena-supervisor[2405]: [error]   LogBackend: unexpected error: Error: getaddrinfo EAI_AGAIN api.balena-cloud.com
Aug 19 10:12:34 9294512 balena-supervisor[2405]: [error]         at GetAddrInfoReqWrap.onlookupall [as oncomplete] (dns.js:76:26)
Aug 19 10:12:49 9294512 balena-supervisor[2405]: [info]    Retrying current state report in 15 seconds
Aug 19 10:12:49 9294512 balena-supervisor[2405]: [event]   Event: Device state report failure {"error":"getaddrinfo EAI_AGAIN api.balena-cloud.com"}
As you can see, the Supervisor is not at all happy, unable to connect to the API
and failing to get the current target state. This is because it is unable to get
an IP address for api.balena-cloud.com.
Worst still, OpenVPN will not be able to resolve the VPN hostname, and so the
device will have dropped 'Offline' (check the Dashboard or use balena devices)
to verify this.
Many other services will be in the same state. A good test of whether DNS is working is to try to get to a known service on the internet, including balenaCloud and Google:
root@9294512:~# curl https://google.com
curl: (6) Could not resolve host: google.com
root@9294512:~# curl https://api.balena-cloud.com/ping
curl: (6) Could not resolve host: api.balena-cloud.com
Both of these should succeed if DNS is working, but as you can see, both give
a Could not resolve host error. This is an extremely good pointer that DNS
is failing.
One thing to be aware of is that sometimes DNS fails not because of an invalid server, but because the traffic for port 53 (the DNS port) is being firewalled (see later section).
For now, we're going to put the DNS service back how it should be:
root@9294512:~# mount -o remount,rw /
root@9294512:~# mv /etc/resolv.dnsmasq.moved /etc/resolv.dnsmasq
root@9294512:~# jq -M 'del(.dnsServers)' /mnt/boot/config.json > /mnt/data/config.json && mv /mnt/data/config.json /mnt/boot/config.json
root@9294512:~# sync
root@9294512:~# reboot
This will put the device back into its previously working DNS state, and it will reconnect to the network.
6.3 OpenVPN
Services: openvpn.service, os-config.service
Device connections to balenaCloud vary depending on the operation being carried out, for example registering the device is carried out by the Supervisor contacting the API endpoint directly.
However, a large part of the cloud-to-device functionality is tunneled by the balena VPN. This include various data such as the device status, actions, SSH access, public URLs etc.
Initially, the os-config.service unit requests a block of configuration data
from the API, once the device has been registered against the fleet. Let's
have a look at the journal output from a device that's been freshly provisioned
and started for the first time:
root@f220105:~# journalctl -f -n 300 -u os-config
-- Journal begins at Fri 2021-08-06 14:40:59 UTC. --
Aug 06 14:41:03 localhost os-config[1610]: Fetching service configuration from https://api.balena-cloud.com/os/v1/config...
Aug 06 14:41:03 localhost os-config[1610]: https://api.balena-cloud.com/os/v1/config: error trying to connect: failed to lookup address information: Name or service not known
Aug 06 14:41:09 f220105 os-config[1610]: https://api.balena-cloud.com/os/v1/config: error trying to connect: error:1416F086:SSL routines:tls_process_server_certificate:certificate verify failed:../openssl-1.1.1l/ssl/statem/statem_clnt.c:1914: (certificate is not yet valid)
Aug 19 10:24:11 f220105 os-config[1610]: Service configuration retrieved
Aug 19 10:24:11 f220105 os-config[1610]: Stopping balena-supervisor.service...
Aug 19 10:24:11 f220105 os-config[1610]: Awaiting balena-supervisor.service to exit...
Aug 19 10:24:11 f220105 os-config[1610]: Stopping prepare-openvpn.service...
Aug 19 10:24:11 f220105 os-config[1610]: Stopping openvpn.service...
Aug 19 10:24:11 f220105 os-config[1610]: Awaiting prepare-openvpn.service to exit...
Aug 19 10:24:11 f220105 os-config[1610]: Awaiting openvpn.service to exit...
Aug 19 10:24:11 f220105 os-config[1610]: /etc/openvpn/ca.crt updated
Aug 19 10:24:11 f220105 os-config[1610]: /etc/openvpn/openvpn.conf updated
Aug 19 10:24:11 f220105 os-config[1610]: Starting prepare-openvpn.service...
Aug 19 10:24:11 f220105 os-config[1610]: Starting openvpn.service...
Aug 19 10:24:11 f220105 os-config[1610]: /home/root/.ssh/authorized_keys_remote updated
Aug 19 10:24:11 f220105 os-config[1610]: Starting balena-supervisor.service...
...
You can see that, once registered, the os-config service requested the
configuration for the device from the API, received it, and then used the
returned data to:
- Stop the Supervisor.
- Write the new OpenVPN configuration to the state partition.
- Write the correct root CA for the VPN to the state partition.
- Restarted the OpenVPN service.
- Updated the authorized keys.
Quick Note: Customers can also specify their own keys to access devices
(both development and production) in a couple of ways. The first is adding
an os.sshKeys[] property, which is an array of public keys, to the
/mnt/boot/config.json file. There is also upcoming support for user
custom keys being added to the API backend.
As you can see, the OpenVPN configuration and Certificate Authority certificate is fetched from the API and not baked in. This allows balena to update their certificates, configurations and keys on the fly, ensuring we can tailor the VPN for the best possible experience and security. However, this does require that the API endpoint is available to periodically refresh the config.
So, what happens if the API isn't available? If this occurs on first boot, then the device wouldn't be able to register, so there wouldn't be a configuration to fetch for it.
On subsequent boots, the API not being initially available isn't as much of an
issue, because there is already a configuration and certificate for the VPN
which can be used until os-config can contact the API to check for new
configurations (and it is unlikely to have changed in the meantime).
Let's now look at the current OpenVPN journal entries on your device. SSH into the device:
$ balena ssh 10.0.0.197
root@f220105:~# journalctl -f -n 200 -u openvpn.service
-- Journal begins at Fri 2021-08-06 14:40:59 UTC. --
Aug 19 10:24:53 f220105 openvpn[2632]: Fri Aug 19 10:24:53 2022 OpenVPN 2.4.7 aarch64-poky-linux-gnu [SSL (OpenSSL)] [LZO] [LZ4] [EPOLL] [MH/PKTINFO] [AEAD] built on Feb 20 2019
Aug 19 10:24:53 f220105 openvpn[2632]: Fri Aug 19 10:24:53 2022 library versions: OpenSSL 1.1.1l  24 Aug 2021, LZO 2.10
Aug 19 10:24:53 f220105 openvpn[2632]: Fri Aug 19 10:24:53 2022 NOTE: the current --script-security setting may allow this configuration to call user-defined scripts
Aug 19 10:24:53 f220105 openvpn[2632]: Fri Aug 19 10:24:53 2022 TCP/UDP: Preserving recently used remote address: [AF_INET6]2600:1f18:6600:7f01:dc24:54f2:d95f:abc0:443
Aug 19 10:24:53 f220105 openvpn[2632]: Fri Aug 19 10:24:53 2022 Socket Buffers: R=[131072->131072] S=[16384->16384]
Aug 19 10:24:53 f220105 openvpn[2632]: Fri Aug 19 10:24:53 2022 Attempting to establish TCP connection with [AF_INET6]2600:1f18:6600:7f01:dc24:54f2:d95f:abc0:443 [nonblock]
Aug 19 10:24:54 f220105 openvpn[2632]: Fri Aug 19 10:24:54 2022 TCP connection established with [AF_INET6]2600:1f18:6600:7f01:dc24:54f2:d95f:abc0:443
Aug 19 10:24:54 f220105 openvpn[2632]: Fri Aug 19 10:24:54 2022 TCP_CLIENT link local: (not bound)
Aug 19 10:24:54 f220105 openvpn[2632]: Fri Aug 19 10:24:54 2022 TCP_CLIENT link remote: [AF_INET6]2600:1f18:6600:7f01:dc24:54f2:d95f:abc0:443
Aug 19 10:24:54 f220105 openvpn[2632]: Fri Aug 19 10:24:54 2022 NOTE: UID/GID downgrade will be delayed because of --client, --pull, or --up-delay
Aug 19 10:24:54 f220105 openvpn[2632]: Fri Aug 19 10:24:54 2022 TLS: Initial packet from [AF_INET6]2600:1f18:6600:7f01:dc24:54f2:d95f:abc0:443, sid=f63c5c5a 9d0382c8
Aug 19 10:24:54 f220105 openvpn[2632]: Fri Aug 19 10:24:54 2022 WARNING: this configuration may cache passwords in memory -- use the auth-nocache option to prevent this
Aug 19 10:24:54 f220105 openvpn[2632]: Fri Aug 19 10:24:54 2022 VERIFY OK: depth=1, C=US, ST=WA, L=Seattle, O=balena.io, OU=balenaCloud, CN=open-balena-vpn-rootCA
Aug 19 10:24:54 f220105 openvpn[2632]: Fri Aug 19 10:24:54 2022 VERIFY KU OK
Aug 19 10:24:54 f220105 openvpn[2632]: Fri Aug 19 10:24:54 2022 Validating certificate extended key usage
Aug 19 10:24:54 f220105 openvpn[2632]: Fri Aug 19 10:24:54 2022 ++ Certificate has EKU (str) TLS Web Server Authentication, expects TLS Web Server Authentication
Aug 19 10:24:54 f220105 openvpn[2632]: Fri Aug 19 10:24:54 2022 VERIFY EKU OK
Aug 19 10:24:54 f220105 openvpn[2632]: Fri Aug 19 10:24:54 2022 VERIFY OK: depth=0, C=US, ST=WA, L=Seattle, O=balena.io, OU=balenaCloud, CN=vpn.balena-cloud.com
Aug 19 10:24:54 f220105 openvpn[2632]: Fri Aug 19 10:24:54 2022 Control Channel: TLSv1.3, cipher TLSv1.3 TLS_AES_256_GCM_SHA384, 2048 bit RSA
Aug 19 10:24:54 f220105 openvpn[2632]: Fri Aug 19 10:24:54 2022 [vpn.balena-cloud.com] Peer Connection Initiated with [AF_INET6]2600:1f18:6600:7f01:dc24:54f2:d95f:abc0:443
Aug 19 10:24:55 f220105 openvpn[2632]: Fri Aug 19 10:24:55 2022 SENT CONTROL [vpn.balena-cloud.com]: 'PUSH_REQUEST' (status=1)
Aug 19 10:24:55 f220105 openvpn[2632]: Fri Aug 19 10:24:55 2022 PUSH: Received control message: 'PUSH_REPLY,sndbuf 0,rcvbuf 0,route 52.4.252.97,ping 10,ping-restart 60,socket-flags TCP_NODELAY,ifconfig 10.242.111.185 52.4.252.97,peer-id 0,cipher AES-128-GCM'
Aug 19 10:24:55 f220105 openvpn[2632]: Fri Aug 19 10:24:55 2022 OPTIONS IMPORT: timers and/or timeouts modified
Aug 19 10:24:55 f220105 openvpn[2632]: Fri Aug 19 10:24:55 2022 OPTIONS IMPORT: --sndbuf/--rcvbuf options modified
Aug 19 10:24:55 f220105 openvpn[2632]: Fri Aug 19 10:24:55 2022 Socket Buffers: R=[131072->131072] S=[87040->87040]
Aug 19 10:24:55 f220105 openvpn[2632]: Fri Aug 19 10:24:55 2022 OPTIONS IMPORT: --socket-flags option modified
Aug 19 10:24:55 f220105 openvpn[2632]: Fri Aug 19 10:24:55 2022 Socket flags: TCP_NODELAY=1 succeeded
Aug 19 10:24:55 f220105 openvpn[2632]: Fri Aug 19 10:24:55 2022 OPTIONS IMPORT: --ifconfig/up options modified
Aug 19 10:24:55 f220105 openvpn[2632]: Fri Aug 19 10:24:55 2022 OPTIONS IMPORT: route options modified
Aug 19 10:24:55 f220105 openvpn[2632]: Fri Aug 19 10:24:55 2022 OPTIONS IMPORT: peer-id set
Aug 19 10:24:55 f220105 openvpn[2632]: Fri Aug 19 10:24:55 2022 OPTIONS IMPORT: adjusting link_mtu to 1627
Aug 19 10:24:55 f220105 openvpn[2632]: Fri Aug 19 10:24:55 2022 OPTIONS IMPORT: data channel crypto options modified
Aug 19 10:24:55 f220105 openvpn[2632]: Fri Aug 19 10:24:55 2022 Data Channel: using negotiated cipher 'AES-128-GCM'
Aug 19 10:24:55 f220105 openvpn[2632]: Fri Aug 19 10:24:55 2022 Outgoing Data Channel: Cipher 'AES-128-GCM' initialized with 128 bit key
Aug 19 10:24:55 f220105 openvpn[2632]: Fri Aug 19 10:24:55 2022 Incoming Data Channel: Cipher 'AES-128-GCM' initialized with 128 bit key
Aug 19 10:24:55 f220105 openvpn[2632]: Fri Aug 19 10:24:55 2022 ROUTE_GATEWAY 10.0.0.1/255.255.255.0 IFACE=eth0 HWADDR=dc:a6:32:9e:18:dd
Aug 19 10:24:55 f220105 openvpn[2632]: Fri Aug 19 10:24:55 2022 TUN/TAP device resin-vpn opened
Aug 19 10:24:55 f220105 openvpn[2632]: Fri Aug 19 10:24:55 2022 TUN/TAP TX queue length set to 100
Aug 19 10:24:55 f220105 openvpn[2632]: Fri Aug 19 10:24:55 2022 /sbin/ip link set dev resin-vpn up mtu 1500
Aug 19 10:24:55 f220105 openvpn[2632]: Fri Aug 19 10:24:55 2022 /sbin/ip addr add dev resin-vpn local 10.242.111.185 peer 52.4.252.97
Aug 19 10:24:55 f220105 openvpn[2632]: Fri Aug 19 10:24:55 2022 /etc/openvpn-misc/upscript.sh resin-vpn 1500 1555 10.242.111.185 52.4.252.97 init
Aug 19 10:24:55 f220105 openvpn[2632]: Fri Aug 19 10:24:55 2022 /sbin/ip route add 52.4.252.97/32 via 52.4.252.97
Aug 19 10:24:55 f220105 openvpn[2656]: ip: RTNETLINK answers: File exists
Aug 19 10:24:55 f220105 openvpn[2632]: Fri Aug 19 10:24:55 2022 ERROR: Linux route add command failed: external program exited with error status: 2
Aug 19 10:24:55 f220105 openvpn[2632]: Fri Aug 19 10:24:55 2022 GID set to openvpn
Aug 19 10:24:55 f220105 openvpn[2632]: Fri Aug 19 10:24:55 2022 UID set to openvpn
Aug 19 10:24:55 f220105 openvpn[2632]: Fri Aug 19 10:24:55 2022 Initialization Sequence Completed
There's a lot to take in here, but there are some key lines here that show that the VPN has negotiated with the backend and is connected and routing traffic:
Aug 19 10:24:53 f220105 openvpn[2632]: Fri Aug 19 10:24:53 2022 Attempting to establish TCP connection with [AF_INET6]2600:1f18:6600:7f01:dc24:54f2:d95f:abc0:443 [nonblock]
Aug 19 10:24:54 f220105 openvpn[2632]: Fri Aug 19 10:24:54 2022 TCP connection established with [AF_INET6]2600:1f18:6600:7f01:dc24:54f2:d95f:abc0:443
Aug 19 10:24:54 f220105 openvpn[2632]: Fri Aug 19 10:24:54 2022 TCP_CLIENT link local: (not bound)
Aug 19 10:24:54 f220105 openvpn[2632]: Fri Aug 19 10:24:54 2022 TCP_CLIENT link remote: [AF_INET6]2600:1f18:6600:7f01:dc24:54f2:d95f:abc0:443
Aug 19 10:24:54 f220105 openvpn[2632]: Fri Aug 19 10:24:54 2022 TLS: Initial packet from [AF_INET6]2600:1f18:6600:7f01:dc24:54f2:d95f:abc0:443, sid=f63c5c5a 9d0382c8
Aug 19 10:24:54 f220105 openvpn[2632]: Fri Aug 19 10:24:54 2022 WARNING: this configuration may cache passwords in memory -- use the auth-nocache option to prevent this
Aug 19 10:24:54 f220105 openvpn[2632]: Fri Aug 19 10:24:54 2022 VERIFY OK: depth=1, C=US, ST=WA, L=Seattle, O=balena.io, OU=balenaCloud, CN=open-balena-vpn-rootCA
Aug 19 10:24:54 f220105 openvpn[2632]: Fri Aug 19 10:24:54 2022 VERIFY KU OK
Aug 19 10:24:54 f220105 openvpn[2632]: Fri Aug 19 10:24:54 2022 Validating certificate extended key usage
Aug 19 10:24:54 f220105 openvpn[2632]: Fri Aug 19 10:24:54 2022 ++ Certificate has EKU (str) TLS Web Server Authentication, expects TLS Web Server Authentication
Aug 19 10:24:54 f220105 openvpn[2632]: Fri Aug 19 10:24:54 2022 VERIFY EKU OK
Aug 19 10:24:54 f220105 openvpn[2632]: Fri Aug 19 10:24:54 2022 VERIFY OK: depth=0, C=US, ST=WA, L=Seattle, O=balena.io, OU=balenaCloud, CN=vpn.balena-cloud.com
Aug 19 10:24:54 f220105 openvpn[2632]: Fri Aug 19 10:24:54 2022 Control Channel: TLSv1.3, cipher TLSv1.3 TLS_AES_256_GCM_SHA384, 2048 bit RSA
Aug 19 10:24:54 f220105 openvpn[2632]: Fri Aug 19 10:24:54 2022 [vpn.balena-cloud.com] Peer Connection Initiated with [AF_INET6]2600:1f18:6600:7f01:dc24:54f2:d95f:abc0:443
Aug 19 10:24:55 f220105 openvpn[2632]: Fri Aug 19 10:24:55 2022 SENT CONTROL [vpn.balena-cloud.com]: 'PUSH_REQUEST' (status=1)
...
Aug 19 10:24:55 f220105 openvpn[2632]: Fri Aug 19 10:24:55 2022 GID set to openvpn
Aug 19 10:24:55 f220105 openvpn[2632]: Fri Aug 19 10:24:55 2022 UID set to openvpn
Aug 19 10:24:55 f220105 openvpn[2632]: Fri Aug 19 10:24:55 2022 Initialization Sequence Completed
The first part of the journal shows that the device has initiated contact with
the VPN backend, accepted the certificate passed to it, and then started the
initialisation of the VPN. We've cut some option stuff out, but the final lines
state Initialization Sequence Completed which is the sign the VPN is up
and running.
There are some things that can affect the VPN. As we saw when discussing NTP, an incorrect time might force the VPN to reject the server certificate, as it wouldn't be in a valid time window.
Additionally, other things that might affect the VPN include the firewalling of non-HTTPS traffic (the VPN uses port 443 as well), the inability to retrieve an initial configuration/CA certificate and Deep Packet Inspection routers that require alternative certificates (we'll go into this later).
Another stumbling block is that if there are VPN issues then this usually means the VPN isn't working, which means the device is not able to go into an 'Online' state, and thus SSHing from the balena CLI or the Dashboard is not possible. In these cases, your best hope is that there is another balena device that is on the same network, to use as a gateway to the failing device (See: 4. Accessing a Device using a Gateway Device). If every balena device on the network is failing to connect to the VPN, this usually indicates the network is being overly restrictive, which becomes a customer issue.
6.4 Firewalled Endpoints
Balena devices work on a variety of networks, but they do require the basic networking environment as listed in 6. Determining Networking Issues.
Firewalls are a sensible precaution in any network, be they personal or corporate. A large number of firewalls are built to provide freedom for devices to initiate connections to an outgoing connection on the wider Internet (where a device in the network can create a connection and receive all data from the Internet based on that connection), but to refuse any incoming connection from the Internet, unless specifically allowed.
On that note, firewalls can include blocklists and allowlists. Most industrial routers and firewalls blocklist everything by default, requiring a set of allowlist IPs and domain names where traffic can be sent/received from.
However, firewalling on some networks can be very aggressive, where without any allowlisting all outgoing and incoming traffic is blocked. Usually, what occurs is that a set list of known ports are allowed to outgoing traffic (and incoming traffic on those connections), but no other traffic is allowed. This is usually tailored by SREs/IT professionals to follow the 'normal' use of nodes on those networks. However, balena devices are sometimes put into these networks and due to the nature of their network requirements, deviate from the 'normal' usage.
Sometimes firewalls can be diagnosed very easily. If a customer has a set of devices on the same network, and they've never come online on that network, it's a fair assumption that a firewall is blocking a required port or ports, and that no traffic is able to make its way out of (or into) the network.
However, sometimes things are slightly more subtle. For example, we've demonstrated what happens when the NTP service is blocked, and the time is greatly skewed. This is sometimes because the network's firewall might be blocking any traffic from/to port 123 (NTP's default port). The same is true for SSL traffic (on port 443).
This can sometimes include traffic to a customer's cloud service. For example, imagine that all the balena requirements are met, so that the device appears to be operating normally, but a customer complains that their device seems to not be able to contact their own cloud servers. It could be that the firewall lets through all the traffic required by balena, but is blocking other arbitrary ports, which might include the ports required by a service on the device.
These are all points which a support engineer should be aware of when investigating a device that is showing abnormal behavior which might be related to a network.
There are some very simple tests that can be carried out to see if most of the network requirements are satisfied:
curlto the API (curl https://api.balena-cloud.com/ping) and VPN (curl https://cloudlink.balena-cloud.com/pingorcurl https://vpn.balena-cloud.com/ping) endpoints to see if a connection is attempted (in the latter case, you'll get an error, but shouldn't get a 'Not found' or 'Timeout' error)- Check
chronyd.serviceto see when it last updated - Ensure that DNS is working (again a
curlto the API endpoint will show if name resolution is working or not) - Ensure that the registry endpoint is not blocked. This will exhibit as the
Supervisor being unable to instruct balenaEngine to pull a release's
service images. A manual attempt at
balena pull <imageDetails>should allow you to see whether any connection is made, or whether it timeouts/ disconnects.
6.4.1 Deep Packet Inspection
Some firewalls and routers implement further restrictions on traffic, namely
that of Deep Packet Inspection (DPI). This is a system where all (or sometimes
select) network packets have their headers and payload inspected to
ensure there is nothing contained which should not be allowed in/out of the
network. This raises several issues of their own. Whilst 'clear' traffic (such
as HTTP, telnet, FTP, etc.) is easy to inspect due to their unencrypted
nature, when it comes to SSL based traffic (including HTTPS and VPN), this
becomes impossible without either the keys that were used to initiate
connections or by terminating the traffic at the DPI firewall/router itself.
Because of this, most DPI networks operate by acting as a proxy for traffic. That is, any node on the network makes connections as normal, but the connections are actually made to the DPI router, which then inspects the traffic and then opens the 'real' connection to the originally requested node on the Internet. Because it is the terminating point for both incoming and outgoing traffic it is able to inspect all the traffic passing it going both out and coming in. However, to do this usually means that nodes within the network need to install a new certificate specifically for the DPI firewall/router, as all encrypted traffic (such as SSL) ends up as being shown to have come from the DPI and not from the endpoint requested (as the DPI has repackaged the traffic).
To determine whether DPI applies to a device, the following commands may be used:
$ curl https://api.balena-cloud.com/ping
curl: (60) server certificate verification failed. CAfile: /etc/ssl/certs/ca-certificates.crt CRLfile: none

$ openssl s_client -connect api.balena-cloud.com:443
CONNECTED(00000003)
depth=1 C = IE, ST = Dublin, L = Dublin, O = Royal College Of Surgeons In Ireland, OU = IT, CN = RCSI-TLS-PROTECT
verify error:num=20:unable to get local issuer certificate
verify return:1
depth=0 CN = balena.io
verify return:1
...
Compare the output of the openssl command on your laptop (where the curl
command succeeds) with the output on the device (where the curl command fails).
Completely different SSL certificate chains may be printed out, indicating that
DPI is in place.
Balena devices are able to accommodate this if it is known a DPI network is in
use, by adding the balenaRootCA property to the /mnt/boot/config.json file,
where the value is the DPI's root Certificate Authority (CA) that has been
base64 encoded. This CA certificate should be supplied by the network operator
7. Working with the config.json File
About config.json
A balenaOS image, by default, does not include any configuration information
to associate it with a fleet. When a customer downloads a provisioning
image from the Dashboard, balenaCloud injects the configuration for the specific
fleet the image is being downloaded for. Similarly, the balena CLI allows
the download of a balenaOS image for a device type (and specific version), but
requires that this image has a configuration added (usually via the use of
balena os configure) before flashing to bootable media.
Note: The config.json file is different from the config.txt file, also located in the boot partition, which is used by the Raspberry Pi to set device configuration options.
The behavior of balenaOS can be configured by editing the
config.json file. This file is located in the boot partition accepts a
range of fields to modify the behavior of the host OS.
The boot partition will be the one that shows up, usually named resin-boot.
On-device, the boot partition is mounted at /mnt/boot/. Assuming you're
still logged into your debug device, run the following:
root@f220105:~# ls -lah /mnt/boot
total 6.6M
drwxr-xr-x 6 root root 2.0K Jan  1  1970 .
drwxr-xr-x 7 root root 1.0K Mar  9  2018 ..
drwxr-xr-x 2 root root  512 Aug 19 06:23 .fseventsd
-rwxr-xr-x 1 root root   24 Jul  8 19:55 balena-image
-rwxr-xr-x 1 root root  17K Jul  8 19:55 balenaos.fingerprint
-rwxr-xr-x 1 root root  51K Jul  8 19:55 bcm2711-rpi-4-b.dtb
-rwxr-xr-x 1 root root  51K Jul  8 19:55 bcm2711-rpi-400.dtb
-rwxr-xr-x 1 root root  51K Jul  8 19:55 bcm2711-rpi-cm4.dtb
-rwxr-xr-x 1 root root  516 Jul  8 19:55 boot.scr
-rwxr-xr-x 1 root root  137 Jul  8 19:55 cmdline.txt
-rwxr-xr-x 1 root root  622 Aug 19 10:24 config.json
-rwxr-xr-x 1 root root  36K Jul  8 19:55 config.txt
-rwxr-xr-x 1 root root 2.1K Jul  8 19:55 device-type.json
-rwxr-xr-x 1 root root    0 Jul  8 19:55 extra_uEnv.txt
-rwxr-xr-x 1 root root 5.3K Jul  8 19:55 fixup4.dat
-rwxr-xr-x 1 root root 3.1K Jul  8 19:55 fixup4cd.dat
-rwxr-xr-x 1 root root 8.2K Jul  8 19:55 fixup4x.dat
-rwxr-xr-x 1 root root   44 Jul  8 19:55 image-version-info
-rwxr-xr-x 1 root root 578K Jul  8 19:55 kernel8.img
-rwxr-xr-x 1 root root  160 Jul  8 19:55 os-release
drwxr-xr-x 2 root root  22K Jul  8 19:55 overlays
-rwxr-xr-x 1 root root    0 Jul  8 19:55 rpi-bootfiles-20220120.stamp
drwxr-xr-x 2 root root  512 Aug 19 10:24 splash
-rwxr-xr-x 1 root root 2.2M Jul  8 19:55 start4.elf
-rwxr-xr-x 1 root root 782K Jul  8 19:55 start4cd.elf
-rwxr-xr-x 1 root root 2.9M Jul  8 19:55 start4x.elf
drwxr-xr-x 2 root root  512 Jul  8 19:55 system-connections
As you can see, all the boot required files exist in the root, including
config.json, and it is from the /mnt/boot mountpoint that any services that
require access to files on the boot partition (including the configuration)
read this data.
Important note: There is an occasional misunderstanding that the directory
/resin-boot when on-device is the correct directory to modify files in.
This is not the case, and in fact this directory is a pre-built directory
that exists as part of the root FS partition, and not the mounted boot
partition. Let's verify this:
root@f220105:~# cat /resin-boot/config.json
{
  "deviceType": "raspberrypi4-64",
  "persistentLogging": false
}
As you can see, there's very little information in the configuration file in
the /resin-boot directory, and certainly nothing that associates it with a
fleet. On the other hand, if we look at /mnt/boot/config.json you can
see that all the required information for the device to be associated with its
fleet exists:
root@f220105:~# cat /mnt/boot/config.json | jq
{
  "apiEndpoint": "https://api.balena-cloud.com",
  "appUpdatePollInterval": 900000,
  "applicationId": "1958513",
  "deltaEndpoint": "https://delta.balena-cloud.com",
  "developmentMode": "true",
  "deviceApiKey": "KEY",
  "deviceApiKeys": {
    "api.balena-cloud.com": "KEY"
  },
  "deviceType": "raspberrypi4-64",
  "listenPort": "48484",
  "mixpanelToken": "9ef939ea64cb6cd8bbc96af72345d70d",
  "registryEndpoint": "registry2.balena-cloud.com",
  "userId": "234385",
  "vpnEndpoint": "cloudlink.balena-cloud.com",
  "vpnPort": "443",
  "uuid": "f220105b5a8aa79b6359d2df76a73954",
  "registered_at": 1660904681747,
  "deviceId": 7842821
}
Key naming in config.json still adheres to the "legacy" convention of
balenaCloud applications instead of fleets. For details, refer to the blog post.
There's a fairly easy way to remember which is the right place, the root FS
is read-only, so if you try and modify the config.json you'll be told it's
read-only.
Configuring config.json
Before the device is provisioned, you may edit config.json by mounting a flashed SD card (with the partition label resin-boot) and editing the file directly. The boot partition is mounted on the device at /mnt/boot, and so on the device, the file is located at /mnt/boot/config.json. For example, to output a formatted version of config.json on a device, use the following commands:
balena ssh <uuid>
cat /mnt/boot/config.json | jq '.'
Warning: Editing config.json on a provisioned device should be done very carefully as any mistakes in the syntax of this file can leave a device inaccessible. If you do make a mistake, ensure that you do not exit the device's SSH connection until the configuration is correct.
After provisioning, editing config.json as described above is not reliable or advisable because the supervisor may overwrite certain fields, such as persistentLogging, with values read from the balenaCloud API. To safely modify the values of config.json on a provisioned device use one of the following methods:
- Update the device hostname via the supervisor API.
- Modify the persistent logging configuration via device configuration tab in the balenaCloud dashboard.
- Apply
config.jsonupdates remotely via the balena CLI using the configizer project.
Alternatively, you can always reprovision a device with an updated config.json file.
As an example, we're going to change the hostname from the short UUID of the
device to something else. We will start by taking a backup of the config.json and printing out the file using the jq command. Here, we have changed the value of hostname field to debug-device
root@f220105:~# cd /mnt/boot/
root@f220105:/mnt/boot# cp config.json config.json.backup && cat config.json.backup | jq ".hostname=\"debug-device\"" -c > config.json
root@f220105:/mnt/boot# cat config.json | jq
{
  "apiEndpoint": "https://api.balena-cloud.com",
  "appUpdatePollInterval": 900000,
  "applicationId": "1958513",
  "applicationName": "nuctest",
  "deltaEndpoint": "https://delta.balena-cloud.com",
  "developmentMode": "true",
  "deviceApiKey": "006e82c27eabcd579ce310687b937cd5",
  "deviceApiKeys": {
    "api.balena-cloud.com": "006e82c27eabcd579ce310687b937cd5"
  },
  "deviceType": "raspberrypi4-64",
  "listenPort": "48484",
  "mixpanelToken": "9ef939ea64cb6cd8bbc96af72345d70d",
  "persistentLogging": false,
  "pubnubPublishKey": "",
  "pubnubSubscribeKey": "",
  "registryEndpoint": "registry2.balena-cloud.com",
  "userId": 234385,
  "vpnEndpoint": "cloudlink.balena-cloud.com",
  "vpnPort": "443",
  "uuid": "f220105b5a8aa79b6359d2df76a73954",
  "registered_at": 1660904681747,
  "deviceId": 7842821,
  "hostname": "debug-device"
}
root@f220105:/mnt/boot# reboot
The reboot is required as the hostname change will not be picked up until the device restarts. Wait a little while, and then SSH back into the device, we'll see that the hostname has changed:
root@debug-device:~#Whilst making the changes, the new configuration is written to the config.json
file, whilst we have a backup of the original (config.json.backup). Remember,
should you need to change anything, always keep a copy of the original configuration
so you can restore it before you exit the device. Check out the
valid fields available to be configured on a balena device.
Sample config.json
The following example provides all customizable configuration options available in config.json. Full details about each option may be found in the valid fields section.
{
  "hostname": "my-custom-hostname",
  "persistentLogging": true,
  "country": "GB",
  "ntpServers": "ntp-wwv.nist.gov resinio.pool.ntp.org",
  "dnsServers": "208.67.222.222 8.8.8.8",
  "os": {
    "network": {
      "connectivity": {
        "uri": "https://api.balena-cloud.com/connectivity-check",
        "interval": "300",
        "response": "optional value in the response"
      },
      "wifi": {
        "randomMacAddressScan": false
      }
    },
    "udevRules": {
      "56": "ENV{ID_FS_LABEL_ENC}==\"resin-root*\", IMPORT{program}=\"resin_update_state_probe $devnode\", SYMLINK+=\"disk/by-state/$env{RESIN_UPDATE_STATE}\"",
      "64": "ACTION!=\"add|change\", GOTO=\"modeswitch_rules_end\"\nKERNEL==\"ttyACM*\", ATTRS{idVendor}==\"1546\", ATTRS{idProduct}==\"1146\", TAG+=\"systemd\", ENV{SYSTEMD_WANTS}=\"u-blox-switch@'%E{DEVNAME}'.service\"\nLBEL=\"modeswitch_rules_end\"\n"
    },
    "sshKeys": [
      "ssh-rsa AAAAB3Nza...M2JB balena@macbook-pro",
      "ssh-rsa AAAAB3Nza...nFTQ balena@zenbook"
    ]
  }
}
Valid fields
The behavior of balenaOS can be configured by setting the following keys in the config.json file in the boot partition. This configuration file is also used by the supervisor.
hostname
(string) The configured hostname of the device, otherwise the device UUID is used.
persistentLogging
(boolean) Enable or disable persistent logging on the device - defaults to false. Once persistent journals are enabled, they end up stored as part of the data partition on the device (either on SD card, eMMC, harddisk, etc.). This is located on-device at /var/log/journal/<uuid> where the UUID is variable.
country
(string) Two-letter country code for the country in which the device is operating. This is used for setting the WiFi regulatory domain, and you should check the WiFi device driver for a list of supported country codes.
ntpServers
(string) A space-separated list of NTP servers to use for time synchronization. Defaults to resinio.pool.ntp.org servers:
0.resinio.pool.ntp.org1.resinio.pool.ntp.org2.resinio.pool.ntp.org3.resinio.pool.ntp.org
dnsServers
(string) A space-separated list of preferred DNS servers to use for name resolution.
- When
dnsServersis not defined, or empty, Google's DNS server (8.8.8.8) is added to the list of DNS servers obtained via DHCP or statically configured in a NetworkManager connection profile. - When
dnsServersis "null" (a string), Google's DNS server (8.8.8.8) will NOT be added as described above. - When
dnsServersis defined and not "null", the listed servers will be added to the list of servers obtained via DHCP or statically configured via a NetworkManager connection profile.
balenaRootCA
(string) A base64-encoded PEM CA certificate that will be installed into the root trust store. This makes the device trust TLS/SSL certificates from this authority. This is useful when the device is running behind a re-encrypting network device, like a transparent proxy or some deep packet inspection devices.
"balenaRootCA": "4oCU4oCTQkVHSU4gQ0VSVElGSUNBVEXigJTi..."developmentMode
To enable development mode at runtime:
"developmentMode": trueBy default development mode enables unauthenticated SSH logins unless custom SSH keys are present, in which case SSH key access is enforced.
Also, development mode provides serial console passwordless login as well as an exposed balena engine socket to use in local mode development.
os
An object containing settings that customize the host OS at runtime.
network
wifi
An object that defines the configuration related to Wi-Fi.
- "randomMacAddressScan" (boolean) Configures MAC address randomization of a Wi-Fi device during scanning
The following example disables MAC address randomization of Wi-Fi device during scanning:
"os": {
 "network" : {
  "wifi": {
    "randomMacAddressScan": false
  }
 }
}
connectivity
An object that defines configuration related to networking connectivity checks. This feature builds on NetworkManager's connectivity check, which is further documented in the connectivity section here.
- "uri" (string) Value of the url to query for connectivity checks. Defaults to
$API_ENDPOINT/connectivity-check. - "interval" (string) Interval between connectivity checks in seconds. Defaults to 3600. To disable the connectivity checks set the interval to "0".
- "response" (string). If set controls what body content is checked for when requesting the URI. If it is an empty value, the HTTP server is expected to answer with status code 204 or send no data.
The following example configures the connectivity check by passing the balenaCloud connectivity endpoint with a 5-minute interval.
"os": {
 "network" : {
  "connectivity": {
    "uri" : "https://api.balena-cloud.com/connectivity-check",
    "interval" : "300"
  }
 }
}
udevRules
An object containing one or more custom udev rules as key:value pairs.
To turn a rule into a format that can be easily added to config.json, use the following command:
cat rulefilename | jq -sR .For example:
root@resin:/etc/udev/rules.d# cat 64.rules | jq -sR .
"ACTION!=\"add|change\", GOTO=\"modeswitch_rules_end\"\nKERNEL==\"ttyACM*\", ATTRS{idVendor}==\"1546\", ATTRS{idProduct}==\"1146\", TAG+=\"systemd\", ENV{SYSTEMD_WANTS}=\"u-blox-switch@'%E{DEVNAME}'.service\"\nLBEL=\"modeswitch_rules_end\"\n"
The following example contains two custom udev rules that will create /etc/udev/rules.d/56.rules and /etc/udev/rules.d/64.rules. The first time rules are added, or when they are modified, udevd will reload the rules and re-trigger.
"os": {
 "udevRules": {
  "56": "ENV{ID_FS_LABEL_ENC}==\"resin-root*\", IMPORT{program}=\"resin_update_state_probe $devnode\", SYMLINK+=\"disk/by-state/$env{BALENA_UPDATE_STATE}\"",
  "64" : "ACTION!=\"add|change\", GOTO=\"modeswitch_rules_end\"\nKERNEL==\"ttyACM*\", ATTRS{idVendor}==\"1546\", ATTRS{idProduct}==\"1146\", TAG+=\"systemd\", ENV{SYSTEMD_WANTS}=\"u-blox-switch@'%E{DEVNAME}'.service\"\nLBEL=\"modeswitch_rules_end\"\n"
 }
}
sshKeys
(Array) An array of strings containing a list of public SSH keys that will be used by the SSH server for authentication.
"os": {
 "sshKeys": [
  "ssh-rsa AAAAB3Nza...M2JB balena@macbook-pro",
  "ssh-rsa AAAAB3Nza...nFTQ balena@zenbook"
 ]
}
fan
An object that defines thermal related configuration. Available for Jetson Orin devices running Jetpack 6 or newer, balenaOS v6.1.24 or newer and Supervisor v16.10.0 or newer.
fan.profile
(string) A string which will be used to select the desired cooling profile. Supported values are "quiet" and "cool". At runtime, this configuration option should be set through the API or from your balenaCloud dashboard.
"os": {
 "fan": {
  "profile":"cool"
 }
}
power
An object that defines power consumption related configuration. Available for Jetson Orin devices running Jetpack 6 or newer, balenaOS v6.1.24 or newer and Supervisor v16.10.0 or newer.
power.mode
(string) A string which will be used to select the desired power mode. Supported values for Jetpack 6 and newer are "low", "mid" and "high", where "low" is the lowest power consumption mode while "high" corresponds to MAXN or the highest available power mode for your device type. At runtime, this configuration option should be set through the API or from your balenaCloud dashboard, and it will cause a device reboot.
"os": {
 "power": {
  "mode":"high"
 }
}
installer
An object that configures the behaviour of the balenaOS installer image.
secureboot
(boolean) Opt-in to installing a secure boot and encrypted disk system for supported device types.
"installer": {
  "secureboot": true
}
migrate
An object that configures the behaviour of the balenaOS installer migration module.
migrate.force
(boolean) Forces the migration to run. By default the migration only runs if
the installer is booting in a single disk system or the migrate argument
is passed in the kernel command line.
"installer": {
  "migrate": {
    "force": true
  }
}
target_devices
(string) Overrides the default list of provisioning target mediums. May contain one or more devices, separated by spaces. The first one found will be used.
"installer": {
  "target_devices":"nvme0n1 sda"
}
8. Working with the Supervisor
Working with the Supervisor
Service: balena-supervisor.service, or resin-supervisor.service if OS < v2.78.0
The balena Supervisor is the service that carries out the management of the software release on a device, including determining when to download updates, the changing of variables, ensuring services are restarted correctly, etc. It is the on-device agent for balenaCloud.
As such, it's imperative that the Supervisor is operational and healthy at all times, even when a device is not connected to the Internet, as the Supervisor still ensures the running of a device that is offline.
The Supervisor itself is a Docker service that runs alongside any installed user services and the healthcheck container. One major advantage of running it as a Docker service is that it can be updated just like any other service, although carrying that out is slightly different than updating user containers. (See Updating the Supervisor).
Before attempting to debug the Supervisor, it's recommended to upgrade the Supervisor to the latest version, as we frequently release bugfixes and features that may resolve device issues.
Otherwise, assuming you're still logged into your development device, run the following:
root@debug-device:~# systemctl status balena-supervisor
● balena-supervisor.service - Balena supervisor
     Loaded: loaded (/lib/systemd/system/balena-supervisor.service; enabled; vendor preset: enabled)
     Active: active (running) since Fri 2022-08-19 18:08:59 UTC; 41s ago
    Process: 2296 ExecStartPre=/usr/bin/balena stop resin_supervisor (code=exited, status=1/FAILURE)
    Process: 2311 ExecStartPre=/usr/bin/balena stop balena_supervisor (code=exited, status=0/SUCCESS)
    Process: 2325 ExecStartPre=/bin/systemctl is-active balena.service (code=exited, status=0/SUCCESS)
   Main PID: 2326 (start-balena-su)
      Tasks: 10 (limit: 1878)
     Memory: 11.9M
     CGroup: /system.slice/balena-supervisor.service
             ├─2326 /bin/sh /usr/bin/start-balena-supervisor
             ├─2329 /proc/self/exe --healthcheck /usr/lib/balena-supervisor/balena-supervisor-healthcheck --pid 2326
             └─2486 balena start --attach balena_supervisor

Aug 19 18:09:07 debug-device balena-supervisor[2486]: [debug]   Starting target state poll
Aug 19 18:09:07 debug-device balena-supervisor[2486]: [debug]   Spawning journald with: chroot  /mnt/root journalctl -a --follow -o json >
Aug 19 18:09:07 debug-device balena-supervisor[2486]: [debug]   Finished applying target state
Aug 19 18:09:07 debug-device balena-supervisor[2486]: [success] Device state apply success
Aug 19 18:09:07 debug-device balena-supervisor[2486]: [info]    Applying target state
Aug 19 18:09:07 debug-device balena-supervisor[2486]: [info]    Reported current state to the cloud
Aug 19 18:09:07 debug-device balena-supervisor[2486]: [debug]   Finished applying target state
Aug 19 18:09:07 debug-device balena-supervisor[2486]: [success] Device state apply success
Aug 19 18:09:17 debug-device balena-supervisor[2486]: [info]    Internet Connectivity: OK
Aug 19 18:09:18 debug-device balena-supervisor[2486]: [info]    Reported current state to the cloud
You can see the Supervisor is just another systemd service
(balena-supervisor.service) and that it is started and run by balenaEngine.
Supervisor issues, due to their nature, vary significantly. Issues may commonly be misattributed to the Supervisor. As the Supervisor is verbose about its state and actions, such as the download of images, it tends to be suspected of problems when in fact there are usually other underlying issues. A few examples are:
- Networking problems - The Supervisor reports failed downloads or attempts to retrieve the same images repeatedly, where in fact unstable networking is usually the cause.
- Service container restarts - The default policy for service containers is to restart if they exit, and this sometimes is misunderstood. If a container is restarting, it's worth ensuring it's not because the container itself is exiting either due to a bug in the service container code or because it has correctly come to the end of its running process.
- Release not being downloaded - For instance, a fleet/device has been pinned to a particular version, and a new push is not being downloaded.
It's always worth considering how the system is configured, how releases were produced, how the fleet or device is configured and what the current networking state is when investigating Supervisor issues, to ensure that there isn't something else amiss that the Supervisor is merely exposing via logging.
Another point to note is that the Supervisor is started using
healthdog which continually
ensures that the Supervisor is present by using balenaEngine to find the
Supervisor image. If the image isn't present, or balenaEngine doesn't respond,
then the Supervisor is restarted. The default period for this check is 180
seconds. Inspecting /lib/systemd/system/balena-supervisor.service on-device
will show whether the timeout period is different for a particular device.
For example:
root@debug-device:~# cat /lib/systemd/system/balena-supervisor.service
[Unit]
Description=Balena supervisor
Requires=\
    resin\x2ddata.mount \
    balena-device-uuid.service \
    os-config-devicekey.service \
    bind-etc-balena-supervisor.service \
    extract-balena-ca.service
Wants=\
    migrate-supervisor-state.service
After=\
    balena.service \
    resin\x2ddata.mount \
    balena-device-uuid.service \
    os-config-devicekey.service \
    bind-etc-systemd-system-resin.target.wants.service \
    bind-etc-balena-supervisor.service \
    migrate-supervisor-state.service \
    extract-balena-ca.service
Wants=balena.service
ConditionPathExists=/etc/balena-supervisor/supervisor.conf

[Service]
Type=simple
Restart=always
RestartSec=10s
WatchdogSec=180
SyslogIdentifier=balena-supervisor
EnvironmentFile=/etc/balena-supervisor/supervisor.conf
EnvironmentFile=-/tmp/update-supervisor.conf
ExecStartPre=-/usr/bin/balena stop resin_supervisor
ExecStartPre=-/usr/bin/balena stop balena_supervisor
ExecStartPre=/bin/systemctl is-active balena.service
ExecStart=/usr/bin/healthdog --healthcheck=/usr/lib/balena-supervisor/balena-supervisor-healthcheck /usr/bin/start-balena-supervisor
ExecStop=-/usr/bin/balena stop balena_supervisor

[Install]
WantedBy=multi-user.target
Alias=resin-supervisor.service
8.1 Restarting the Supervisor
It's rare to actually need a Supervisor restart. The Supervisor will attempt to recover from issues that occur automatically, without the requirement for a restart. When in doubt about whether a restart is required, look at the Supervisor logs and double check other on-duty support agents if needed. If fairly certain, it's generally safe to restart the Supervisor, as long as the user is aware that some extra bandwidth and device resources will be used on startup.
There are instances where the Supervisor is incorrectly restarted when in fact the issue could be the corruption of service images, containers, volumes or networking. In these cases, you're better off dealing with the underlying balenaEngine to ensure that anything corrupt is recreated correctly. See the balenaEngine section for more details.
If a restart is required, ensure that you have gathered as much information as possible before a restart, including pertinent logs and symptoms so that investigations can occur asynchronously to determine what occurred and how it may be mitigated in the future. Enabling persistent logging may also be beneficial in cases where symptoms are repeatedly occurring.
To restart the Supervisor, simply restart the systemd service:
root@debug-device:~# systemctl restart balena-supervisor.service
root@debug-device:~# systemctl status balena-supervisor.service
● balena-supervisor.service - Balena supervisor
     Loaded: loaded (/lib/systemd/system/balena-supervisor.service; enabled; vendor preset: enabled)
     Active: active (running) since Fri 2022-08-19 18:13:28 UTC; 10s ago
    Process: 3013 ExecStartPre=/usr/bin/balena stop resin_supervisor (code=exited, status=1/FAILURE)
    Process: 3021 ExecStartPre=/usr/bin/balena stop balena_supervisor (code=exited, status=0/SUCCESS)
    Process: 3030 ExecStartPre=/bin/systemctl is-active balena.service (code=exited, status=0/SUCCESS)
   Main PID: 3031 (start-balena-su)
      Tasks: 11 (limit: 1878)
     Memory: 11.8M
     CGroup: /system.slice/balena-supervisor.service
             ├─3031 /bin/sh /usr/bin/start-balena-supervisor
             ├─3032 /proc/self/exe --healthcheck /usr/lib/balena-supervisor/balena-supervisor-healthcheck --pid 3031
             └─3089 balena start --attach balena_supervisor

Aug 19 18:13:33 debug-device balena-supervisor[3089]: [info]    Waiting for connectivity...
Aug 19 18:13:33 debug-device balena-supervisor[3089]: [debug]   Starting current state report
Aug 19 18:13:33 debug-device balena-supervisor[3089]: [debug]   Starting target state poll
Aug 19 18:13:33 debug-device balena-supervisor[3089]: [debug]   Spawning journald with: chroot  /mnt/root journalctl -a --follow -o json >
Aug 19 18:13:33 debug-device balena-supervisor[3089]: [debug]   Finished applying target state
Aug 19 18:13:33 debug-device balena-supervisor[3089]: [success] Device state apply success
Aug 19 18:13:34 debug-device balena-supervisor[3089]: [info]    Applying target state
Aug 19 18:13:34 debug-device balena-supervisor[3089]: [info]    Reported current state to the cloud
Aug 19 18:13:34 debug-device balena-supervisor[3089]: [debug]   Finished applying target state
Aug 19 18:13:34 debug-device balena-supervisor[3089]: [success] Device state apply success
8.2 Updating the Supervisor
Occasionally, there are situations where the Supervisor requires an update. This may be because a device needs to use a new feature or because the version of the Supervisor on a device is outdated and is causing an issue. Usually the best way to achieve this is via a balenaOS update, either from the dashboard or via the command line on the device.
If updating balenaOS is not desirable or a user prefers updating the Supervisor independently, this can easily be accomplished using self-service Supervisor upgrades. Alternatively, this can be programmatically done by using the Node.js SDK method device.setSupervisorRelease.
You can additionally write a script to manage this for a fleet of devices in combination with other SDK functions such as device.getAll.
Note: In order to update the Supervisor release for a device, you must have edit permissions on the device (i.e., more than just support access).
8.3 The Supervisor Database
The Supervisor uses a SQLite database to store persistent state, so in the case of going offline, or a reboot, it knows exactly what state an app should be in, and which images, containers, volumes and networks to apply to it.
This database is located at
/mnt/data/resin-data/balena-supervisor/database.sqlite and can be accessed
inside the Supervisor container at /data/database.sqlite by running Node.
Assuming you're logged into your device, run the following:
root@debug-device:~# balena exec -ti balena_supervisor nodeThis will get you into a Node interpreter in the Supervisor service
container. From here, we can use the sqlite3 NPM module used by
the Supervisor to make requests to the database:
> sqlite3 = require('sqlite3');
{
  Database: [Function: Database],
  Statement: [Function: Statement],
  Backup: [Function: Backup],
  OPEN_READONLY: 1,
  OPEN_READWRITE: 2,
  OPEN_CREATE: 4,
  OPEN_FULLMUTEX: 65536,
  OPEN_URI: 64,
  OPEN_SHAREDCACHE: 131072,
  OPEN_PRIVATECACHE: 262144,
  VERSION: '3.30.1',
  SOURCE_ID: '2019-10-10 20:19:45 18db032d058f1436ce3dea84081f4ee5a0f2259ad97301d43c426bc7f3df1b0b',
  VERSION_NUMBER: 3030001,
  OK: 0,
  ERROR: 1,
  INTERNAL: 2,
  PERM: 3,
  ABORT: 4,
  BUSY: 5,
  LOCKED: 6,
  NOMEM: 7,
  READONLY: 8,
  INTERRUPT: 9,
  IOERR: 10,
  CORRUPT: 11,
  NOTFOUND: 12,
  FULL: 13,
  CANTOPEN: 14,
  PROTOCOL: 15,
  EMPTY: 16,
  SCHEMA: 17,
  TOOBIG: 18,
  CONSTRAINT: 19,
  MISMATCH: 20,
  MISUSE: 21,
  NOLFS: 22,
  AUTH: 23,
  FORMAT: 24,
  RANGE: 25,
  NOTADB: 26,
  cached: { Database: [Function: Database], objects: {} },
  verbose: [Function]
}
> db = new sqlite3.Database('/data/database.sqlite');
Database {
  open: false,
  filename: '/data/database.sqlite',
  mode: 65542
}
You can get a list of all the tables used by the Supervisor by issuing:
> db.all("SELECT name FROM sqlite_master WHERE type='table' ORDER BY name;", console.log);
Database { open: true, filename: '/data/database.sqlite', mode: 65542 }
> null [
  { name: 'apiSecret' },
  { name: 'app' },
  { name: 'config' },
  { name: 'containerLogs' },
  { name: 'currentCommit' },
  { name: 'deviceConfig' },
  { name: 'engineSnapshot' },
  { name: 'image' },
  { name: 'knex_migrations' },
  { name: 'knex_migrations_lock' },
  { name: 'logsChannelSecret' },
  { name: 'sqlite_sequence' }
]
With these, you can then examine and modify data, if required. Note that there's usually little reason to do so, but this is included for completeness. For example, to examine the configuration used by the Supervisor:
> db.all('SELECT * FROM config;', console.log);
Database { open: true, filename: '/data/database.sqlite', mode: 65542 }
> null [
  { key: 'localMode', value: 'false' },
  { key: 'initialConfigSaved', value: 'true' },
  {
    key: 'initialConfigReported',
    value: 'https://api.balena-cloud.com'
  },
  { key: 'name', value: 'shy-rain' },
  { key: 'targetStateSet', value: 'true' },
  { key: 'delta', value: 'true' },
  { key: 'deltaVersion', value: '3' }
]
Occasionally, should the Supervisor get into a state where it is unable to determine which release images it should be downloading or running, it is necessary to clear the database. This usually goes hand-in-hand with removing the current containers and putting the Supervisor into a 'first boot' state, whilst keeping the Supervisor and release images. This can be achieved by carrying out the following:
root@debug-device:~# systemctl stop balena-supervisor.service update-balena-supervisor.timer
root@debug-device:~# balena rm -f $(balena ps -aq)
1db1d281a548
6c5cde1581e5
2a9f6e83578a
root@debug-device:~# rm /mnt/data/resin-data/balena-supervisor/database.sqlite
This:
- Stops the Supervisor (and the timer that will attempt to restart it).
- Removes all current service containers, including the Supervisor.
- Removes the Supervisor database.
(If for some reason the images also need to be removed, run
balena rmi -f $(balena images -q)which will remove all images including the Supervisor image). You can now restart the Supervisor:
root@debug-device:~# systemctl start update-balena-supervisor.timer balena-supervisor.serviceIf you deleted all the images, this will first download the Supervisor image again before restarting it. At this point, the Supervisor will start up as if the device has just been provisioned and already registered, and the device's target release will be freshly downloaded if images were removed before starting the service containers.
9. Working with balenaEngine
9. Working with balenaEngine
Service: balena.service
balenaEngine is balena's fork of Docker, offering a range of added features including real delta downloads, minimal disk writes (for reduced media wear) and other benefits for edge devices, in a small resource footprint.
balenaEngine is responsible for the fetching and storage of service images, as well as their execution as service containers, the creation of defined networks and creation and storage of persistent data to service volumes. As such, it is an extremely important part of balenaOS.
Additionally, as the Supervisor is also executed as a container, it is required for its operation. This means that should balenaEngine fail for some reason, it is likely that the Supervisor will also fail.
Issues with balenaEngine themselves are rare, although it can be initially tempting to attribute them to balenaEngine instead of the actual underlying issue. A couple of examples of issues which are misattributed to :
- Failure to download release service updates - usually because there is an underlying network problem, or possibly issues with free space
- Failure to start service containers - most commonly customer services exit abnormally (or don't have appropriate error checking) although a full data partition can also occur, as can corrupt images
Reading the journal for balenaEngine is similar to all other systemd services.
Log into your device and then execute the following:
root@dee2945:~# journalctl --follow -n 100 --unit balena.service
...
What you'll first notice here is that there's Supervisor output here. This is because balenaEngine is running the Supervisor and it pipes all Supervisor logs to its own service output. This comes in particularly useful if you need to examine the journal, because it will show both balenaEngine and Supervisor output in the same logs chronologically.
Assuming your device is still running the pushed multicontainer app, we can also see additionally logging for all the service containers. To do so, we'll restart balenaEngine, so that the services are started again. This output shows the last 50 lines of the balenaEngine journal after a restart.
root@debug-device:~# systemctl restart balena.service
root@debug-device:~# journalctl --all --follow -n 50 --unit balena.service
-- Journal begins at Fri 2022-08-19 18:08:10 UTC. --
Aug 19 18:24:36 debug-device balenad[4566]: time="2022-08-19T18:24:36.794621631Z" level=info msg="shim balena-engine-containerd-shim started" address=/containerd-shim/d7b6a623d687aea38a743fc79898e57bc3b43da3dbe144499bea2a068ad6700f.sock debug=false pid=5157
Aug 19 18:24:38 debug-device e593ab6439fe[4543]: [info]    Supervisor v14.0.8 starting up...
Aug 19 18:24:39 debug-device e593ab6439fe[4543]: [info]    Setting host to discoverable
Aug 19 18:24:39 debug-device e593ab6439fe[4543]: [warn]    Invalid firewall mode: . Reverting to state: off
Aug 19 18:24:39 debug-device e593ab6439fe[4543]: [info]    Applying firewall mode: off
Aug 19 18:24:39 debug-device e593ab6439fe[4543]: [debug]   Starting systemd unit: avahi-daemon.service
Aug 19 18:24:39 debug-device e593ab6439fe[4543]: [debug]   Starting systemd unit: avahi-daemon.socket
Aug 19 18:24:39 debug-device e593ab6439fe[4543]: [debug]   Starting logging infrastructure
Aug 19 18:24:39 debug-device e593ab6439fe[4543]: [info]    Starting firewall
Aug 19 18:24:39 debug-device e593ab6439fe[4543]: [debug]   Performing database cleanup for container log timestamps
Aug 19 18:24:39 debug-device e593ab6439fe[4543]: [success] Firewall mode applied
Aug 19 18:24:39 debug-device e593ab6439fe[4543]: [debug]   Starting api binder
Aug 19 18:24:39 debug-device e593ab6439fe[4543]: [info]    Previous engine snapshot was not stored. Skipping cleanup.
Aug 19 18:24:39 debug-device e593ab6439fe[4543]: [debug]   Handling of local mode switch is completed
Aug 19 18:24:39 debug-device e593ab6439fe[4543]: (node:1) [DEP0005] DeprecationWarning: Buffer() is deprecated due to security and usability issues. Please use the Buffer.alloc(), Buffer.allocUnsafe(), or Buffer.from() methods instead.
Aug 19 18:24:39 debug-device e593ab6439fe[4543]: [debug]   Spawning journald with: chroot  /mnt/root journalctl -a -S 2022-08-19 18:19:08 -o json CONTAINER_ID_FULL=4ce5bebc27c67bc198662cc38d7052e9d7dd3bfb47869ba83a88a74aa498c51f
Aug 19 18:24:39 debug-device e593ab6439fe[4543]: [info]    API Binder bound to: https://api.balena-cloud.com/v6/
Aug 19 18:24:39 debug-device e593ab6439fe[4543]: [event]   Event: Supervisor start {}
Aug 19 18:24:39 debug-device e593ab6439fe[4543]: [debug]   Spawning journald with: chroot  /mnt/root journalctl -a -S 2022-08-19 18:19:07 -o json CONTAINER_ID_FULL=2e2a7fcfe6f6416e32b9fa77b3a01265c9fb646387dbf4410ca90147db73a4ff
Aug 19 18:24:39 debug-device e593ab6439fe[4543]: [debug]   Connectivity check enabled: true
Aug 19 18:24:39 debug-device e593ab6439fe[4543]: [debug]   Starting periodic check for IP addresses
Aug 19 18:24:39 debug-device e593ab6439fe[4543]: [info]    Reporting initial state, supervisor version and API info
Aug 19 18:24:39 debug-device e593ab6439fe[4543]: [debug]   Skipping preloading
Aug 19 18:24:39 debug-device e593ab6439fe[4543]: [info]    Starting API server
Aug 19 18:24:39 debug-device e593ab6439fe[4543]: [info]    Supervisor API successfully started on port 48484
Aug 19 18:24:39 debug-device e593ab6439fe[4543]: [debug]   VPN status path exists.
Aug 19 18:24:39 debug-device e593ab6439fe[4543]: [info]    Applying target state
Aug 19 18:24:39 debug-device e593ab6439fe[4543]: [debug]   Ensuring device is provisioned
Aug 19 18:24:39 debug-device e593ab6439fe[4543]: [info]    VPN connection is active.
Aug 19 18:24:39 debug-device e593ab6439fe[4543]: [info]    Waiting for connectivity...
Aug 19 18:24:39 debug-device e593ab6439fe[4543]: [debug]   Starting current state report
Aug 19 18:24:39 debug-device e593ab6439fe[4543]: [debug]   Starting target state poll
Aug 19 18:24:39 debug-device e593ab6439fe[4543]: [debug]   Spawning journald with: chroot  /mnt/root journalctl -a --follow -o json _SYSTEMD_UNIT=balena.service
Aug 19 18:24:40 debug-device e593ab6439fe[4543]: [debug]   Finished applying target state
Aug 19 18:24:40 debug-device e593ab6439fe[4543]: [success] Device state apply success
Aug 19 18:24:40 debug-device e593ab6439fe[4543]: [info]    Reported current state to the cloud
Aug 19 18:24:40 debug-device e593ab6439fe[4543]: [info]    Applying target state
Aug 19 18:24:40 debug-device e593ab6439fe[4543]: [debug]   Finished applying target state
Aug 19 18:24:40 debug-device e593ab6439fe[4543]: [success] Device state apply success
Aug 19 18:24:49 debug-device e593ab6439fe[4543]: [info]    Internet Connectivity: OK
9.1 Service Image, Container and Volume Locations
balenaEngine stores all its writeable data in the /var/lib/docker directory,
which is part of the data partition. We can see this by using the mount
command:
root@debug-device:~# mount | grep lib/docker
/dev/mmcblk0p6 on /var/lib/docker type ext4 (rw,relatime)
/dev/mmcblk0p6 on /var/volatile/lib/docker type ext4 (rw,relatime)
All balenaEngine state is stored in here, include images, containers and volume data. Let's take a brief look through the most important directories and explain the layout, which should help with investigations should they be required.
Run balena images on your device:
root@debug-device:~# balena images
REPOSITORY                                                       TAG       IMAGE ID       CREATED        SIZE
registry2.balena-cloud.com/v2/8f425c77879116f77e6c8fcdebb37210   latest    f0735c857f39   32 hours ago   250MB
registry2.balena-cloud.com/v2/9664d653a6ecc4fe2c7e0cb18e64a3d2   latest    3128dae78199   32 hours ago   246MB
balena_supervisor                                                v14.0.8   936d20a463f5   7 weeks ago    75.7MB
registry2.balena-cloud.com/v2/04a158f884a537fc1bd11f2af797676a   latest    936d20a463f5   7 weeks ago    75.7MB
balena-healthcheck-image                                         latest    46331d942d63   5 months ago   9.14kB
Each image has an image ID. These identify each image uniquely for operations upon it, such as executing it as a container, removal, etc. We can inspect an image to look at how it's made up:
root@debug-device:~# balena inspect f0735c857f39
[
    {
        "Id": "sha256:f0735c857f39ebb303c5e908751f8ac51bbe0f999fe06b96d8bfc1a562e0f5ad",
        "RepoTags": [
            "registry2.balena-cloud.com/v2/8f425c77879116f77e6c8fcdebb37210:latest"
        ],
        "RepoDigests": [
            "registry2.balena-cloud.com/v2/8f425c77879116f77e6c8fcdebb37210@sha256:45c002b1bb325c1b93ff333a82ff401c9ba55ca7d00118b31a1c992f6fc5a4a4"
        ],
        "Parent": "",
        "Comment": "",
        "Created": "2022-08-18T10:17:31.25910477Z",
        "Container": "312d5c69d19954518ae932398ab9afa144feabff83906216759cffba925d9128",
        "ContainerConfig": {
            "Hostname": "faf98ca57090",
            "Domainname": "",
            "User": "",
            "AttachStdin": false,
            "AttachStdout": false,
            "AttachStderr": false,
            "Tty": false,
            "OpenStdin": false,
            "StdinOnce": false,
            "Env": [
                "PATH=/usr/local/sbin:/usr/local/bin:/usr/sbin:/usr/bin:/sbin:/bin",
                "LC_ALL=C.UTF-8",
                "DEBIAN_FRONTEND=noninteractive",
                "UDEV=off",
                "NODE_VERSION=10.22.0",
                "YARN_VERSION=1.22.4"
            ],
            "Cmd": [
                "/bin/sh",
                "-c",
                "#(nop) ",
                "CMD [\"npm\" \"start\"]"
            ],
            "Image": "sha256:c6072db33ab31c868fbce36621d57ddad8cf29b679027b7007d37ac40beea58c",
            "Volumes": null,
            "WorkingDir": "/usr/src/app",
            "Entrypoint": [
                "/usr/bin/entry.sh"
            ],
            "OnBuild": [],
            "Labels": {
                "io.balena.architecture": "aarch64",
                "io.balena.device-type": "jetson-tx2",
                "io.balena.qemu.version": "4.0.0+balena2-aarch64"
            }
        },
        "DockerVersion": "v19.03.12",
        "Author": "",
        "Config": {
            "Hostname": "faf98ca57090",
            "Domainname": "",
            "User": "",
            "AttachStdin": false,
            "AttachStdout": false,
            "AttachStderr": false,
            "Tty": false,
            "OpenStdin": false,
            "StdinOnce": false,
            "Env": [
                "PATH=/usr/local/sbin:/usr/local/bin:/usr/sbin:/usr/bin:/sbin:/bin",
                "LC_ALL=C.UTF-8",
                "DEBIAN_FRONTEND=noninteractive",
                "UDEV=off",
                "NODE_VERSION=10.22.0",
                "YARN_VERSION=1.22.4"
            ],
            "Cmd": [
                "npm",
                "start"
            ],
            "Image": "sha256:c6072db33ab31c868fbce36621d57ddad8cf29b679027b7007d37ac40beea58c",
            "Volumes": null,
            "WorkingDir": "/usr/src/app",
            "Entrypoint": [
                "/usr/bin/entry.sh"
            ],
            "OnBuild": [],
            "Labels": {
                "io.balena.architecture": "aarch64",
                "io.balena.device-type": "jetson-tx2",
                "io.balena.qemu.version": "4.0.0+balena2-aarch64"
            }
        },
        "Architecture": "amd64",
        "Os": "linux",
        "Size": 249802248,
        "VirtualSize": 249802248,
        "GraphDriver": {
            "Data": {
                "LowerDir": "/var/lib/docker/overlay2/0bc07f1279e00affc344c22f64b9f3985225fe3e06f13103e24b983b1a9fdd0e/diff:/var/lib/docker/overlay2/27229498851db6327bf134ba8ab869655a20bf5e602a435a58e03684088baf7a/diff:/var/lib/docker/overlay2/b0d957f3e2636fe4dc5b10855ad276dc0e53fa95a5c3e2ed3fa56dcee23dc50f/diff:/var/lib/docker/overlay2/4489255833d1236ba41a2d15761f065eba992069569075d0a9edf2cd53e8415f/diff:/var/lib/docker/overlay2/f77ebf3b4836d289c2515c82537cd774354b7342c2a4899fcffb51ac23e9e9b7/diff:/var/lib/docker/overlay2/c5a96f1657a4073293c3364eab567a1f62b5d7761b8dbc3617369ffbd516c8f0/diff:/var/lib/docker/overlay2/168a1333d7a784f1b1ecbe6202f8a8189e592407195349f7d2dad943084876e6/diff:/var/lib/docker/overlay2/dd17e88dd38b700214d8f13c3d820d1f808c4b1a138f91dafd729f6369d95110/diff:/var/lib/docker/overlay2/641c77f5a0c9f25154fbd868c253c8a8e894e3cebd9ba5b96cebb9384c6283d7/diff:/var/lib/docker/overlay2/8d428280199e4dc05de155f1f3b0ef63fdeef14e09662ce5676d8b1d790bdf5d/diff:/var/lib/docker/overlay2/bcc97249ce05979fc9aa578c976f770083e9948a1c1d64c05444591a7aad35a9/diff:/var/lib/docker/overlay2/41773d1c239c8a0bf31096d43ae7e17b5ca48f10530c13d965259ed386cb20d9/diff:/var/lib/docker/overlay2/697de96abdf1ae56449b0b01ce99ef867c821404d876f2b55eac8ccb760a1bc1/diff:/var/lib/docker/overlay2/4518e2c4e4ca2b5b6b26ed40a8e3f130296625c9a8c6a47c61763bf789e8df12/diff:/var/lib/docker/overlay2/662d75e19e4a9a98442111f551f48bd8841de472f16c755405276462122e1969/diff:/var/lib/docker/overlay2/338c3b3a4977e96ed25d1f2b9fbc65562a8c62a185df6baabe64dd3e40632331/diff:/var/lib/docker/overlay2/88069ce00e7cf154912b583ac49e2eb655af35777a22f68d65e560a8f8f72fb0/diff:/var/lib/docker/overlay2/7fa0af02f451bafb29410b8d6712bb84cfead585aca227dd899631b357eba12c/diff:/var/lib/docker/overlay2/fbaf99abadbb408297dae5626b85415bf62fdc40dce4ec4df11ff5f8043306b3/diff:/var/lib/docker/overlay2/f871aa611f42e273ef69b8ee3a686e084b6eddaf9d20c36e10904e4e44013fe1/diff:/var/lib/docker/overlay2/d21067d6f38aebbe391336a2251aac02e0bda38db313de18d417c12f20eba067/diff:/var/lib/docker/overlay2/daa9d5a342f3234c8f7dc2905dbbaee1823821b828f3e92b0092c9e83e56cbde/diff:/var/lib/docker/overlay2/c31888f5276a034a32c1017906f32a79000971067dee4f85c3ef87717c00fe94/diff",
                "MergedDir": "/var/lib/docker/overlay2/2b7065b1b4192e5232b470d308e4992a47d7ab4786a7fcc9356682512c69d2ec/merged",
                "UpperDir": "/var/lib/docker/overlay2/2b7065b1b4192e5232b470d308e4992a47d7ab4786a7fcc9356682512c69d2ec/diff",
                "WorkDir": "/var/lib/docker/overlay2/2b7065b1b4192e5232b470d308e4992a47d7ab4786a7fcc9356682512c69d2ec/work"
            },
            "Name": "overlay2"
        },
        "RootFS": {
            "Type": "layers",
            "Layers": [
                "sha256:af0df278bec194015fd6f217c017da2cc48c7c0dfc55974a4f1da49f1fd9c643",
                "sha256:1d3545625acc456a3b1ffe0452dc7b21b912414514f6636776d1df5f7fc5b761",
                "sha256:d50c820f06af93966310405459feaa06ae25099493e924827ecc2b87d59b81bc",
                "sha256:c73bea5e51f02ae807581a4308b93bb15f2a4e8eff77980f04ca16ada3e5d8fe",
                "sha256:30781fcde1e029490e5e31142c6f87eea28f44daa1660bf727149255095aeb25",
                "sha256:06333a8766d373657969d2c5a1785426b369f0eb67d3131100562e814944bb61",
                "sha256:afe83b1715ba56fe1075387e987414f837ad1153e0dc83983b03b21af1fff524",
                "sha256:b5b49d315a0b1d90a0e7f5bf0c9f349b64b83868aa4965846b05fb1c899b4d31",
                "sha256:40e07aec657d65d0b3c2fd84983c3f725cf342a11ac8f694d19d8162556389ca",
                "sha256:1ec17697083e5ab6e6657cb2fd3ac213bfb621497196a9b4dd01be49a05fd0ba",
                "sha256:8cdee574cf2ff2bff80961902b11f378bd228d11f4e52135fd404f79ca7e1a63",
                "sha256:b4cb326982763715403b5101026ad8333e2b5d59868cce0ddf21d1a231715758",
                "sha256:94893f94e0143c27cfd1367699776035e144b4c3b3cff1c1423253f6e2b39723",
                "sha256:8a743afad01d015d44b64fd0bedf583145d04796a429aa261596e0e6943bda7f",
                "sha256:faa977113a35d9b622af3bb1a481a7ee5bdbc3f6c35dc8ff4ff5adb8b4a95641",
                "sha256:59461c292cd4bd0f3fbd808371d37845e1850ed7b9c2e676b484c60950bdd3ba",
                "sha256:285f1fb0f99ea936e0eeb5f78c83b050c3b8f334a956a40f9ec547ac29b3a58d",
                "sha256:d653d2b6a0bde68b3194e62baec92a2ef2223cd9c56e3ea4844b38886b63798e",
                "sha256:234dc1e17bed2bae6e5368c2667c30124dca94f0b584f5cd8b0f2be249311820",
                "sha256:c2630cbbb8b9413cc6d8d5bd4fcdebf54d987d62e0a2c68cf8dadb5cc831209d",
                "sha256:a5311ef02278680ab6c2cf1a5843845f5802ed024fce4f69eb8e8ea53b7a5b4e",
                "sha256:188bd1bf502d426d5e897e31773fa885399fd69ceef850609cdaa4a45f330c71",
                "sha256:43cb5b1fb08f5faa3ae526d509b5faa014ce9b8f1099b27e87f8cc3992a973c5",
                "sha256:896037576e604880800e50afde6184d54e3f50b3cede0f564dcdd3e3243bba5a"
            ]
        },
        "Metadata": {
            "LastTagTime": "2022-08-19T18:24:39.169388977Z"
        }
    }
]
Of particular interest here is the "RootFS" section, which shows all of the
layers that make up an image. Without going into detail (there are plenty of
easily Google-able pages describing this), each balena image is made up of a
series of layers, usually associated with a COPY, ADD, RUN, etc.
Dockerfile command at build time. Each layer makes up part of the images
file system, and when a service container is created from an image, it uses
these layers 'merged' together for the underlying file system.
We can look at these individual layers by making a note of each SHA256 hash ID
and then finding this hash in the /var/lib/docker/image/overlay2/layerdb/sha256 directory
This directory holds a set of directories, each named after each unique layer using
the SHA256 associated with it. Let's look at the layer DB directory:
root@debug-device:~# ls -lah /var/lib/docker/image/overlay2/layerdb/sha256
total 176K
drwxr-xr-x 44 root root 4.0K Aug 19 10:25 .
drwx------  5 root root 4.0K Aug 19 10:24 ..
drwx------  2 root root 4.0K Aug 19 10:25 09b78bc523987759f021e0a0e83e69c8084b1e3c20f14b4bb9534f3cdcc6ac3c
drwx------  2 root root 4.0K Jul  8 18:39 1036152b568007807de32d686a009c3f4f8adbb4f472e82ac274a27d92326d80
drwx------  2 root root 4.0K Jul  8 18:39 106a406f45c345ecbc3c42525606f80b084daf9f3423615a950c4cf5a696caa7
drwx------  2 root root 4.0K Aug 19 10:25 144d2c5112d686b5a4b14f3d4d9d8426981debc440ae533e3c374148089a66d3
drwx------  2 root root 4.0K Jul  8 18:39 1f9ad706e17e7786d85618534db2a36bb51b8aaaadd9a7e32d1e7080054ff620
drwx------  2 root root 4.0K Aug 19 10:25 21331e0e0fe982279deb041181d6af17bcd8ac70dc7dc023c225d2cfb3c33b7f
drwx------  2 root root 4.0K Jul  8 18:39 253123a3e5d5904ceeedc9b7f22f95baa93228cf7eeb8a659b2e7893e2206d32
drwx------  2 root root 4.0K Jul  8 18:39 294ac687b5fcac6acedb9a20cc756ffe39ebc87e8a0214d3fb8ef3fc3189ee2a
drwx------  2 root root 4.0K Jul  8 18:39 2ef1f0e36f419227844367aba4ddfa90df1294ab0fe4993e79d56d9fe3790362
drwx------  2 root root 4.0K Aug 19 10:24 35e3a8f4d7ed3009f84e29161552f627523e42aea57ac34c92502ead41691ce9
drwx------  2 root root 4.0K Jul  8 18:39 3eb45474328f8742c57bd7ba683431fe5f0a5154e12e382814a649cc0c4115b4
drwx------  2 root root 4.0K Jul  8 18:39 4acac926cb8671f570045c0a1dc1d73c1ca4fbfeee82b8b69b26b095a53bd9b7
drwx------  2 root root 4.0K Jul  8 18:39 4c345896c7e7169034e1cd5ae7a6ded46623c904503e37cfe0f590356aed869a
drwx------  2 root root 4.0K Aug 19 10:25 4c4fb86d946143f592f295993169aa9d48e51a2583d0905874a3a122843d6ef1
drwx------  2 root root 4.0K Jul  8 18:39 4eb65237b6a403037e5a629c93f0efd25c8cf6bc78a0c4c849e6a7d4f76892bc
drwx------  2 root root 4.0K Aug 19 10:25 521a7e6b1a2ca6e5417331c9bb9330fd94b48ec80d80099fc5cbffce33f0b871
drwx------  2 root root 4.0K Jul  8 18:39 5a5de1543b2bc574adae2f477ae308ea21d8bfcdd3828b01b1cf1b3e54e757bf
drwx------  2 root root 4.0K Aug 19 10:25 60ef73a52c9699144533715efa317f7e4ff0c066697ae0bb5936888ee4097664
drwx------  2 root root 4.0K Aug 19 10:25 7754099c5f93bb0d0269ea8193d7f81e515c7709b48c5a0ca5d7682d2f15def2
drwx------  2 root root 4.0K Aug 19 10:25 7a9f44ed69912ac134baabbe16c4e0c6293750ee023ec22488b3e3f2a73392a6
drwx------  2 root root 4.0K Aug 19 10:25 81713bf891edc214f586ab0d02359f3278906b2e53e034973300f8c7deb72ca2
drwx------  2 root root 4.0K Aug 19 10:25 8515f286995eb469b1816728f2a7dc140d1a013601f3a942d98441e49e6a38e9
drwx------  2 root root 4.0K Aug 19 10:25 8c0972b6057fafdf735562e0a92aa3830852b462d8770a9301237689dbfa6036
drwx------  2 root root 4.0K Aug 19 10:25 a1659a5774b2cd9f600b9810ac3fa159d1ab0b6c532ff22851412fe8ff21c45e
drwx------  2 root root 4.0K Aug 19 10:25 aa293c70cb6bdafc80e377b36c61368f1d418b33d56dcbc60b3088e945c24784
drwx------  2 root root 4.0K Aug 19 10:25 abaae3be7599181738152e68cfd2dcf719068b3e23de0f68a85f1bfe0a3ebe6e
drwx------  2 root root 4.0K Aug 19 10:25 acd72d7857fe303e90cd058c8b48155a0c2706ff118045baedf377934dcd5d63
drwx------  2 root root 4.0K Aug 19 10:24 af0df278bec194015fd6f217c017da2cc48c7c0dfc55974a4f1da49f1fd9c643
drwx------  2 root root 4.0K Aug 19 10:25 b9c29dbb49463dcc18dbf10d5188453a3c3d3159dd42b9fb403d3846649b8c1f
drwx------  2 root root 4.0K Aug 19 10:25 bc60d12607d916904e332fc94997d59b5619885fbb51af0e885ca21e88faec7f
drwx------  2 root root 4.0K Aug 19 10:25 c3414c33510eabf6a77f68f6714967484e7a937681d30f4578ed4415a889abbf
drwx------  2 root root 4.0K Aug 19 10:25 d89860b1b17fbfc46a8c09473504697efc768895910a383c21182c073caa249d
drwx------  2 root root 4.0K Aug 19 10:25 e665e5030545a1d1f8bb3ad1cda5a5d0bad976a23005313157e242e6a3a5932e
drwx------  2 root root 4.0K Aug 19 10:25 e80af4b706db8380d5bb3d88e4262147edfaad362fe4e43cf96658709c21195a
drwx------  2 root root 4.0K Jul  8 18:39 eb8f1151aa650015a9e6517542b193760795868a53b7644c54b5ecdac5453ede
drwx------  2 root root 4.0K Jul  8 18:39 efb53921da3394806160641b72a2cbd34ca1a9a8345ac670a85a04ad3d0e3507
drwx------  2 root root 4.0K Aug 19 10:25 f77763335291f524fee886c06f0f81f23b38638ba40c4695858cd8cca3c92c46
drwx------  2 root root 4.0K Aug 19 10:25 f92d2ac421bffffd2811552a43b88a0cc4b4fe2faa26ec85225d68e580447dc4
drwx------  2 root root 4.0K Aug 19 10:25 fae75b52757886e2f56dd7f8fbf11f5aa30ff848745b2ebf169477941282f9f9
drwx------  2 root root 4.0K Aug 19 10:25 fc810c085b1a4492e6191b546c9708b3777cbb8976744d5119ed9e00e57e7bc6
drwx------  2 root root 4.0K Jul  8 18:39 fd22d21dd7203b414e4d4a8d61f1e7feb80cbef515c7d38dc98f091ddaa0d4a2
drwx------  2 root root 4.0K Jul  8 18:39 fd6efabf36381d1f93ba9485e6b4d3d9d9bdb4eff7d52997362e4d29715eb18a
Note that there are layers named here that are not named in the "RootFS"
object in the image description (although base image layers usually are). This
is because of the way balenaEngine describes layers and naming internally
(which we will not go into here). However, each layer is described by a
cache-id which is a randomly generated UUID. You can find the cache-id
for a layer by searching for it in the layer DB directory:
root@debug-device:~# cd /var/lib/docker/image/overlay2/layerdb/sha256/
root@debug-device:/var/lib/docker/image/overlay2/layerdb/sha256# grep -r 09b78bc523987759f021e0a0e83e69c8084b1e3c20f14b4bb9534f3cdcc6ac3c *
7754099c5f93bb0d0269ea8193d7f81e515c7709b48c5a0ca5d7682d2f15def2/parent:sha256:09b78bc523987759f021e0a0e83e69c8084b1e3c20f14b4bb9534f3cdcc6ac3c
In this case, we find two entries, but we're only interested in the directory
with the diff file result, as this describes the diff for the layer:
root@debug-device:/var/lib/docker/image/overlay2/layerdb/sha256# cat 09b78bc523987759f021e0a0e83e69c8084b1e3c20f14b4bb9534f3cdcc6ac3c/cache-id
f77ebf3b4836d289c2515c82537cd774354b7342c2a4899fcffb51ac23e9e9b7
We now have the corresponding cache-id for the layer's directory layout,
and we can now examine the file system for this layer (all the diffs are
stored in the /var/lib/docker/overlay2/<ID>/diff directory):
roroot@debug-device:~# du -hc /var/lib/docker/overlay2/f278e81229574468df2f798e3ffbe576a51c2ad0c752c0b1997fdb33314130ae/diff/
8.0K    /var/lib/docker/overlay2/f278e81229574468df2f798e3ffbe576a51c2ad0c752c0b1997fdb33314130ae/diff/root/.config/configstore
16K    /var/lib/docker/overlay2/f278e81229574468df2f798e3ffbe576a51c2ad0c752c0b1997fdb33314130ae/diff/root/.config
24K    /var/lib/docker/overlay2/f278e81229574468df2f798e3ffbe576a51c2ad0c752c0b1997fdb33314130ae/diff/root
4.0K    /var/lib/docker/overlay2/f278e81229574468df2f798e3ffbe576a51c2ad0c752c0b1997fdb33314130ae/diff/tmp/balena
4.0K    /var/lib/docker/overlay2/f278e81229574468df2f798e3ffbe576a51c2ad0c752c0b1997fdb33314130ae/diff/tmp/resin
12K    /var/lib/docker/overlay2/f278e81229574468df2f798e3ffbe576a51c2ad0c752c0b1997fdb33314130ae/diff/tmp
4.0K    /var/lib/docker/overlay2/f278e81229574468df2f798e3ffbe576a51c2ad0c752c0b1997fdb33314130ae/diff/run/mount
8.0K    /var/lib/docker/overlay2/f278e81229574468df2f798e3ffbe576a51c2ad0c752c0b1997fdb33314130ae/diff/run
48K    /var/lib/docker/overlay2/f278e81229574468df2f798e3ffbe576a51c2ad0c752c0b1997fdb33314130ae/diff/
48K    total
You can find the diffs for subsequent layers in the same way.
However, whilst this allows you to examine all the layers for an image, the
situation changes slightly when an image is used to create a container. At this
point, a container can also bind to volumes (persistent data directories across
container restarts) and writeable layers that are used only for that container
(which are not persistent across container restarts). Volumes are described in
a later section dealing with media storage. However, we will show an example
here of creating a writeable layer in a container and finding it in the
appropriate /var/lib/docker directory.
Assuming you're running the source code that goes along with this masterclass, SSH into your device:
root@debug-device:~# balena ps
CONTAINER ID   IMAGE                                                            COMMAND                  CREATED          STATUS                    PORTS     NAMES
4ce5bebc27c6   3128dae78199                                                     "/usr/bin/entry.sh n…"   27 minutes ago   Up 22 minutes                       backend_5298819_2265201_0a9d4b0e8c1ff1202773ac2104a2bb48
2e2a7fcfe6f6   f0735c857f39                                                     "/usr/bin/entry.sh n…"   27 minutes ago   Up 22 minutes                       frontend_5298818_2265201_0a9d4b0e8c1ff1202773ac2104a2bb48
e593ab6439fe   registry2.balena-cloud.com/v2/04a158f884a537fc1bd11f2af797676a   "/usr/src/app/entry.…"   27 minutes ago   Up 22 minutes (healthy)             balena_supervisor
You should see something similar. Let's pick the backend service, which in
this instance is container 4ce5bebc27c6. We'll exec into it via a bash
shell, and create a new file. This will create a new writeable layer for the
container:
root@debug-device:~# balena exec -ti 4ce5bebc27c6 /bin/bash
root@4ce5bebc27c6:/usr/src/app# echo 'This is a new, container-only writeable file!' > /mynewfile.txt
root@4ce5bebc27c6:/usr/src/app# cat /mynewfile.txt
This is a new, container-only writeable file!
root@4ce5bebc27c6:/usr/src/app# exit
Now we'll determine where this new file has been stored by balenaEngine.
Similarly to the images, any writeable layer ends up in the
/var/lib/docker/overlay2/<ID>/diff directory, but to determine the correct layer ID
we need to examine the layer DB for it. We do this by looking in the
/var/lib/docker/image/overlay2/layerdb/mounts directory, which lists all the
currently created containers:
root@debug-device:~# cd /var/lib/docker/image/overlay2/layerdb/mounts
root@debug-device:~# ls -lh
total 12K
drwxr-xr-x 2 root root 4.0K Aug 19 18:19 2e2a7fcfe6f6416e32b9fa77b3a01265c9fb646387dbf4410ca90147db73a4ff
drwxr-xr-x 2 root root 4.0K Aug 19 18:19 4ce5bebc27c67bc198662cc38d7052e9d7dd3bfb47869ba83a88a74aa498c51f
drwxr-xr-x 2 root root 4.0K Aug 19 18:19 e593ab6439fee4f5003e68e616fbaf3c3dfd7e37838b1e27d9773ecb65fb26c6
As you can see, there's a list of all the container IDs of those container
that have been created. If we look for the mount-id file in the directory
for the backend container, that will include the layer ID of the layer that
has been created. From there, we simply look in the appropriate diff layer
directory to find our newly created file (the awk command below is to add
a newline to the end of the discovered value for clarity reasons):
root@debug-device:~# cd /var/lib/docker/image/overlay2/layerdb/mounts
root@debug-device:/var/lib/docker/image/overlay2/layerdb/mounts# cat 4ce5bebc27c67bc198662cc38d7052e9d7dd3bfb47869ba83a88a74aa498c51f/mount-id | awk '{ print $1 }'
18d634420eceb9792f57554a5451510c1a3e38efe15552045d9b074c5120ef3c
root@debug-device:/var/lib/docker/image/overlay2/layerdb/mounts# cat /var/lib/docker/overlay2/18d634420eceb9792f57554a5451510c1a3e38efe15552045d9b074c5120ef3c/diff/mynewfile.txt
This is a new, container-only writeable file!
9.2 Restarting balenaEngine
As with the Supervisor, it's very rare to actually need to carry this out.
However, for completeness, should you need to, this again is as simple as
carrying out a systemd restart with systemctl restart balena.service:
root@debug-device:~# systemctl restart balena.service
root@debug-device:~# systemctl status balena.service
● balena.service - Balena Application Container Engine
     Loaded: loaded (/lib/systemd/system/balena.service; enabled; vendor preset: enabled)
    Drop-In: /etc/systemd/system/balena.service.d
             └─storagemigration.conf
     Active: active (running) since Fri 2022-08-19 19:00:03 UTC; 13s ago
TriggeredBy: ● balena-engine.socket
       Docs: https://www.balena.io/docs/getting-started
   Main PID: 8721 (balenad)
      Tasks: 60 (limit: 1878)
     Memory: 130.2M
     CGroup: /system.slice/balena.service
             ├─4544 /proc/self/exe --healthcheck /usr/lib/balena/balena-healthcheck --pid 4543
             ├─8721 /usr/bin/balenad --experimental --log-driver=journald --storage-driver=overlay2 -H fd:// -H unix:///var/run/balena.so>
             ├─8722 /proc/self/exe --healthcheck /usr/lib/balena/balena-healthcheck --pid 8721
             ├─8744 balena-engine-containerd --config /var/run/balena-engine/containerd/containerd.toml --log-level info
             ├─8922 balena-engine-containerd-shim -namespace moby -workdir /var/lib/docker/containerd/daemon/io.containerd.runtime.v1.lin>
             ├─8941 balena-engine-containerd-shim -namespace moby -workdir /var/lib/docker/containerd/daemon/io.containerd.runtime.v1.lin>
             ├─9337 balena-engine-containerd-shim -namespace moby -workdir /var/lib/docker/containerd/daemon/io.containerd.runtime.v1.lin>
             └─9343 balena-engine-runc --root /var/run/balena-engine/runtime-balena-engine-runc/moby --log /run/balena-engine/containerd/>

Aug 19 19:00:06 debug-device e593ab6439fe[8721]: [info]    Applying target state
Aug 19 19:00:06 debug-device e593ab6439fe[8721]: [debug]   Finished applying target state
Aug 19 19:00:06 debug-device e593ab6439fe[8721]: [success] Device state apply success
Aug 19 19:00:06 debug-device e593ab6439fe[8721]: [info]    Reported current state to the cloud
Aug 19 19:00:14 debug-device balenad[8721]: time="2022-08-19T19:00:14.615648023Z" level=info msg="Container failed to exit within 10s of >
Aug 19 19:00:15 debug-device balenad[8744]: time="2022-08-19T19:00:15.074224040Z" level=info msg="shim reaped" id=e593ab6439fee4f5003e68e>
Aug 19 19:00:15 debug-device balenad[8721]: time="2022-08-19T19:00:15.077066553Z" level=info msg="ignoring event" container=e593ab6439fee>
Aug 19 19:00:16 debug-device balenad[8721]: time="2022-08-19T19:00:16.870509180Z" level=warning msg="Configured runtime \"runc\" is depre>
Aug 19 19:00:16 debug-device balenad[8744]: time="2022-08-19T19:00:16.911032847Z" level=warning msg="runtime v1 is deprecated since conta>
Aug 19 19:00:16 debug-device balenad[8744]: time="2022-08-19T19:00:16.916761744Z" level=info msg="shim balena-engine-containerd-shim star>
However, doing so has also had another side-effect. Because the Supervisor is itself comprised of a container, restarting balenaEngine has also stopped and restarted the Supervisor. This is another good reason why balenaEngine should only be stopped/restarted if absolutely necessary.
So, when is absolutely necessary? There are some issues which occasionally occur that might require this.
One example could be due to corruption in the /var/lib/docker directory, usually related to:
- Memory exhaustion and investigation
- Container start/stop conflicts
Many examples of these are documented in the support knowledge base, so we will not delve into them here.
9.3 Quick Troubleshooting Tips
Here are some quick tips we have found useful when troubleshooting balenaEngine issues.
Running health check manually. If you suspect balenaEngine's health check may be failing, a good thing to try is running the check manually:
root@debug-device:~# /usr/lib/balena/balena-healthcheckOn success, this return 0 and will not print any output. But on error, this may provide you more information than you'd get anywhere else.
Is a pull running? It's not always obvious that an image pull is really
running. A quick way to check this is to look for any docker-untar processes:
root@b96099c:~# ps aux | grep docker-untar
root        2980 91.0  4.1 1267328 40488 ?       Rl   13:28   0:00 docker-untar / /var/lib/docker/overlay2/1f03416754d567ad88d58ea7fd40db3cdc8275c61de63c0ad8aa644bc87bb690/diff
This docker-untar process is spawned by balenaEngine to decompress the image
data as it arrives, so it's a subtle but sure clue that a pull is running.
10. Using the Kernel Logs
There are occasionally instances where a problem arises which is not immediately obvious. In these cases, you might see services fail 'randomly', perhaps attached devices don't behave as they should, or maybe spurious reboots occur.
If an issue isn't apparent fairly soon after looking at a device, the examination of the kernel logs can be a useful check to see if anything is causing an issue.
To examine the kernel log on-device, simply run dmesg from the host OS:
root@debug-device:~# dmesg
[    0.000000] Booting Linux on physical CPU 0x0000000000 [0x410fd083]
[    0.000000] Linux version 5.10.95-v8 (oe-user@oe-host) (aarch64-poky-linux-gcc (GCC) 11.2.0, GNU ld (GNU Binutils) 2.37.20210721) #1 SMP PREEMPT Thu Feb 17 11:43:01 UTC 2022
[    0.000000] random: fast init done
[    0.000000] Machine model: Raspberry Pi 4 Model B Rev 1.2
[    0.000000] efi: UEFI not found.
[    0.000000] Reserved memory: created CMA memory pool at 0x000000001ac00000, size 320 MiB
[    0.000000] OF: reserved mem: initialized node linux,cma, compatible id shared-dma-pool
[    0.000000] Zone ranges:
[    0.000000]   DMA      [mem 0x0000000000000000-0x000000003fffffff]
[    0.000000]   DMA32    [mem 0x0000000040000000-0x000000007fffffff]
[    0.000000]   Normal   empty
[    0.000000] Movable zone start for each node
[    0.000000] Early memory node ranges
[    0.000000]   node   0: [mem 0x0000000000000000-0x000000003e5fffff]
[    0.000000]   node   0: [mem 0x0000000040000000-0x000000007fffffff]
[    0.000000] Initmem setup node 0 [mem 0x0000000000000000-0x000000007fffffff]
[    0.000000] On node 0 totalpages: 517632
[    0.000000]   DMA zone: 4096 pages used for memmap
[    0.000000]   DMA zone: 0 pages reserved
[    0.000000]   DMA zone: 255488 pages, LIFO batch:63
[    0.000000]   DMA32 zone: 4096 pages used for memmap
[    0.000000]   DMA32 zone: 262144 pages, LIFO batch:63
[    0.000000] On node 0, zone DMA32: 512 pages in unavailable ranges
[    0.000000] percpu: Embedded 32 pages/cpu s92376 r8192 d30504 u131072
[    0.000000] pcpu-alloc: s92376 r8192 d30504 u131072 alloc=32*4096
[    0.000000] pcpu-alloc: [0] 0 [0] 1 [0] 2 [0] 3
[    0.000000] Detected PIPT I-cache on CPU0
[    0.000000] CPU features: detected: Spectre-v2
[    0.000000] CPU features: detected: Spectre-v4
[    0.000000] CPU features: detected: ARM errata 1165522, 1319367, or 1530923
[    0.000000] Built 1 zonelists, mobility grouping on.  Total pages: 509440
[    0.000000] Kernel command line: coherent_pool=1M 8250.nr_uarts=0 snd_bcm2835.enable_compat_alsa=0 snd_bcm2835.enable_hdmi=1  smsc95xx.macaddr=DC:A6:32:9E:18:DD vc_mem.mem_base=0x3f000000 vc_mem.mem_size=0x3f600000  dwc_otg.lpm_enable=0 rootfstype=ext4 rootwait dwc_otg.lpm_enable=0 rootwait vt.global_cursor_default=0 console=null cgroup_enable=memory root=UUID=ba1eadef-20c9-4504-91f4-275265fa5dbf rootwait
[    0.000000] cgroup: Enabling memory control group subsystem
[    0.000000] Dentry cache hash table entries: 262144 (order: 9, 2097152 bytes, linear)
[    0.000000] Inode-cache hash table entries: 131072 (order: 8, 1048576 bytes, linear)
[    0.000000] mem auto-init: stack:off, heap alloc:off, heap free:off
[    0.000000] software IO TLB: mapped [mem 0x000000003a600000-0x000000003e600000] (64MB)
[    0.000000] Memory: 1602680K/2070528K available (11392K kernel code, 2022K rwdata, 4460K rodata, 14208K init, 1284K bss, 140168K reserved, 327680K cma-reserved)
[    0.000000] SLUB: HWalign=64, Order=0-3, MinObjects=0, CPUs=4, Nodes=1
[    0.000000] ftrace: allocating 44248 entries in 173 pages
[    0.000000] ftrace: allocated 173 pages with 5 groups
[    0.000000] rcu: Preemptible hierarchical RCU implementation.
[    0.000000] rcu:     RCU event tracing is enabled.
[    0.000000] rcu:     RCU restricting CPUs from NR_CPUS=256 to nr_cpu_ids=4.
[    0.000000]     Trampoline variant of Tasks RCU enabled.
[    0.000000]     Rude variant of Tasks RCU enabled.
[    0.000000]     Tracing variant of Tasks RCU enabled.
[    0.000000] rcu: RCU calculated value of scheduler-enlistment delay is 25 jiffies.
[    0.000000] rcu: Adjusting geometry for rcu_fanout_leaf=16, nr_cpu_ids=4
[    0.000000] NR_IRQS: 64, nr_irqs: 64, preallocated irqs: 0
[    0.000000] GIC: Using split EOI/Deactivate mode
[    0.000000] irq_brcmstb_l2: registered L2 intc (/soc/interrupt-controller@7ef00100, parent irq: 10)
[    0.000000] random: get_random_bytes called from start_kernel+0x3a4/0x570 with crng_init=1
[    0.000000] arch_timer: cp15 timer(s) running at 54.00MHz (phys).
[    0.000000] clocksource: arch_sys_counter: mask: 0xffffffffffffff max_cycles: 0xc743ce346, max_idle_ns: 440795203123 ns
[    0.000007] sched_clock: 56 bits at 54MHz, resolution 18ns, wraps every 4398046511102ns
[    0.000332] Console: color dummy device 80x25
[    0.000405] Calibrating delay loop (skipped), value calculated using timer frequency.. 108.00 BogoMIPS (lpj=216000)
[    0.000443] pid_max: default: 32768 minimum: 301
[    0.000643] LSM: Security Framework initializing
[    0.000891] Mount-cache hash table entries: 4096 (order: 3, 32768 bytes, linear)
[    0.000939] Mountpoint-cache hash table entries: 4096 (order: 3, 32768 bytes, linear)
...
The rest of the output is truncated here. Note that the time output is in
seconds. If you want to display a human readable time, use the -T switch.
This will, however, strip the nanosecond accuracy and revert to chronological
order with a minimum granularity of a second.
Note that the 'Device Diagnostics' tab from the 'Diagnostics' section of a
device also runs dmesg -T and will display these in the output window.
However, due to the sheer amount of information presented here, it's sometimes
easier to run it on-device.
Some common issues to watch for include:
- Under-voltage warnings, signifying that a device is not receiving what it requires from the power supply to operate correctly (these warnings are only present on the Raspberry Pi series).
- Block device warnings, which could signify issues with the media that balenaOS is running from (for example, SD card corruption).
- Device detection problems, where devices that are expected to show in the device node list are either incorrectly detected or misdetected.
11. Media Issues
Sometimes issues occur with the media being used (the medium that balenaOS and all other data is stored on, for example an SD card or eMMC drive).
This can include multiple issues, but the most common are that of exhaustion of free space on a device, or that of SD card corruption.
11.1 Out of Space Issues
A media partition that is full can cause issues such as the following:
- Failure to download release updates, or failure to start new/updated services after a download has occurred
- Failure for a service to store data into defined volumes
- Failure of services to start up (mostly those that need to store data that
isn't in
tmpfs)
Determining how much space is left on the media for a device can be achieved by logging into the host OS and running:
root@debug-device:~# df -h
Filesystem                      Size  Used Avail Use% Mounted on
devtmpfs                        783M     0  783M   0% /dev
tmpfs                           950M  5.3M  945M   1% /run
/dev/mmcblk0p2                  300M  276M  4.5M  99% /mnt/sysroot/active
/dev/disk/by-state/resin-state   18M   75K   16M   1% /mnt/state
overlay                         300M  276M  4.5M  99% /
/dev/mmcblk0p6                   29G  367M   27G   2% /mnt/data
tmpfs                           950M     0  950M   0% /dev/shm
tmpfs                           4.0M     0  4.0M   0% /sys/fs/cgroup
tmpfs                           950M     0  950M   0% /tmp
tmpfs                           950M   40K  950M   1% /var/volatile
/dev/mmcblk0p1                   40M  7.2M   33M  19% /mnt/boot
/dev/mmcblk0p3                  300M   14K  280M   1% /mnt/sysroot/inactive
The -h switch makes the figures returned 'human readable'. Without this switch
the returned figures will be in block sizes (usually 1k or 512byte blocks).
The two main mounts where full space problems commonly occur are /mnt/data and
/mnt/state. The former is the data partition where all service images, containers
and volumes are stored. The latter is the state partition, where overlays for the
root FS (such as user defined network configurations) and the permanent logs
are stored.
There are a few ways to try and relieve out of space issues on a media drive.
11.1.1 Image and Container Pruning
One fairly easy cleanup routine to perform is that of pruning the Docker tree so that any unused images, containers, networks and volumes are removed. It should be noted that in the day-to-day operation of the Supervisor, it attempts to ensure that anything that is no longer used on the device is removed when not required. However, there are issues that sometimes occur that can cause this behavior to not work correctly. In these cases, a prune should help clean anything that should not be present:
root@debug-device:~# balena system prune -a -f --volumes
Deleted Images:
untagged: balena-healthcheck-image:latest
deleted: sha256:46331d942d6350436f64e614d75725f6de3bb5c63e266e236e04389820a234c4
deleted: sha256:efb53921da3394806160641b72a2cbd34ca1a9a8345ac670a85a04ad3d0e3507
untagged: balena_supervisor:v14.0.8

Total reclaimed space: 9.136kB
Note that in the above, all unused images, containers, networks and volumes
will be removed. To just remove dangling images, you can use
balena system prune -a.
11.1.2 Customer Data
Occasionally, customer volumes can also fill up the data partition. This obviously causes more issues, because usually this is data that cannot just be deleted. In these cases, it's imperative that the customer is informed that they've filled the data partition and that appropriate pruning is required. Filling disk space does not tend to stop access to devices, so in these cases customers should be asked to enter the relevant services and manually prune data.
Before discussion on persistent data, it's worth noting that occasionally customer apps store data to the service container instead of a persistent data volume. Sometimes, this data is intended as temporary, so doing so is not an issue (although if they are doing so and expecting it to stay permanent, this will not occur as service container rebuilds will remove the layers where new data is stored). However there are cases where even this temporary data can be so large that it fills the storage media. In these cases, the Supervisor can be stopped, and then the service container affected, allowing that container to be removed so the Supervisor can rebuild from the service image. This will remove the layers filling the space. Care should be taken and customers informed first, in case this data is required. They should also be informed of persistent data and how to use it.
Because persistent data is stored as volumes, it's also possible to prune data for a service from within the host OS. For example, should a service be filling a volume so quickly as to prevent sensible data removal, an option is to stop that service and then manually remove data from the service's volume.
Data volumes are always located in the /var/lib/docker/volumes directory. Care
needs to be taken to ensure the right volumes are examine/pruned of data, as
not all volumes pertain directly to customer data. Let's list the volumes:
root@debug-device:~# ls -l /var/lib/docker/volumes/
total 28
drwx-----x 3 root root  4096 Aug 19 19:15 1958513_backend-data
-rw------- 1 root root 32768 Aug 19 19:15 metadata.db
In single service apps, the relevant data volume is suffixed with the
_balena-data string.
In multicontainer apps, the suffix always corresponds with the name
of the bound volume. For example, let's look at the docker-compose manifest
for the multicontainer-app app used in this debugging masterclass:
version: '2.1'
volumes:
  backend-data: {}
services:
  frontend:
    build: ./frontend
    network_mode: host
  backend:
    build: ./backend
    labels:
      io.balena.features.supervisor-api: '1'
      io.balena.features.balena-api: '1'
    privileged: true
    volumes:
      - 'backend-data:/mydata'
As you can see, a backend-data volume is defined, and then used by the
backend service. Assuming your device is still running the multicontainer
app for this masterclass, SSH into the device, and then examine the
running services:
root@debug-device:~# balena ps
CONTAINER ID   IMAGE                                                            COMMAND                  CREATED              STATUS                    PORTS     NAMES
330d34540489   3128dae78199                                                     "/usr/bin/entry.sh n…"   About a minute ago   Up About a minute                   backend_5302053_2266082_28d1b0e8e99c2ae6b7361f3b0f835f5c
2e2a7fcfe6f6   f0735c857f39                                                     "/usr/bin/entry.sh n…"   57 minutes ago       Up 16 minutes                       frontend_5302052_2266082_28d1b0e8e99c2ae6b7361f3b0f835f5c
e593ab6439fe   registry2.balena-cloud.com/v2/04a158f884a537fc1bd11f2af797676a   "/usr/src/app/entry.…"   57 minutes ago       Up 16 minutes (healthy)             balena_supervisor
root@debug-device:~# balena inspect backend_5302053_2266082_28d1b0e8e99c2ae6b7361f3b0f835f5c | grep /var/lib/docker/volumes
                "Source": "/var/lib/docker/volumes/1958513_backend-data/_data",
The volume is denoted with the suffix of the defined volume name.
Should there be multiple volumes, then appropriate directories for these will
be created in the /var/lib/docker/volumes directory, with the relevant
suffixes.
Knowing this, it becomes fairly simple to stop services that have filled volumes and to clear these out:
- Stop the Supervisor and start timer (
balena-supervisor.serviceandupdate-balena-supervisor.timer). - Determine the relevant data directories for the volumes filling the data partition.
- Clean them appropriately.
- Restart the Supervisor and start timer.
11.2 Storage Media Corruption
Many device types use storage media that has high wear levels. This includes devices such as the Raspberry Pi series, where SD cards are the usual storage media. Because we recommend very hard-wearing cards (the SanDisk Extreme Pro family are extremely resilient), we don't regularly have issues with customer devices dying due to SD card failure. However, they do occur (and not just on SD cards, any type of flash memory based storage includes a shorter lifespan compared to media such as platter drives). Initially, media corruption and wearing exhibit 'random' signs, including but not limited to:
- Release updates failing to download/start/stop.
- Services suddenly restarting.
- Devices not being mapped to device nodes.
- Extreme lag when interacting with services/utilities from the CLI.
- Spurious kernel errors.
In fact, media corruption could potentially exhibit as any sort of issue, because there's (generally) no way to determine where wearing may exhibit itself. Additionally, we have seen issues where media write/reads take so long that they also adversely impact the system (for example, healthchecks may take too long to occur, which could potentially restart services including the Supervisor and balenaEngine), in these cases swapping the media for a known, working brand has caused this issues to be resolved.
One quick check that can be carried out is the root filing system integrity check. This checks the MD5 hashes fingerprints of all the files in the filing system against those when they were built. This tends to give an idea of whether corruption may be an issue (but it certainly isn't guaranteed). SSH into your device and run the following:
root@debug-device:~# grep -v "/var/cache/ldconfig/aux-cache" /balenaos.fingerprint | md5sum --quiet -c -If the check returns successfully, none of the files differ in their MD5 fingerprints from when they were built.
Generally, if it appears that media corruption may be an issue, we generally check with customers if they're running a recommended media brand, and if not ask them to do so.
Should the worst happen and a device is no longer bootable due to filesystem corruption, they still have the option of recovering data from the device. In this case, they'll need to remove the media (SD card, HDD, etc.) from the device and then follow appropriate instructions.
Similar commands to check for storage corruption although can sometime provide false positives.
journalctl -n 10000 | grep "corrupt|Data will be lost|block allocation failed|invalid magic|dockerd: error -117|EXT4-fs error|error count since last fsck|failed checksum|checksum invalid|Please run e2fsck|I/O error"12. Device connectivity status
Conclusion
In this masterclass, you've learned how to deal with balena devices as a support agent. You should now be confident enough to:
- Request access from a customer and access their device, including 'offline' devices on the same network as one that is 'online'.
- Run diagnostics checks and understand their results.
- Understand the core balenaOS services that make up the system, including the ability to read journals from those services, as well as stopping, starting and restarting them.
- Enable persistent logs, and then examine them when required.
- Diagnose and handle a variety of network issues.
- Understand and work with the
config.jsonconfiguration file. - Understand the Supervisor's role, including key concepts.
- Understand the balenaEngine's role, including key concepts.
- Be able to look at kernel logs, and determine some common faults.
- Work with media issues, including dealing with full media, working with customer data, and diagnosing corruption issues.
- Understand why your device's status is Online (Heartbeat Only) or Online (VPN Only) and how it can be impacting your app.